Does Hydratec Industries NV (AMS:HYDRA) Have A Good P/E Ratio?

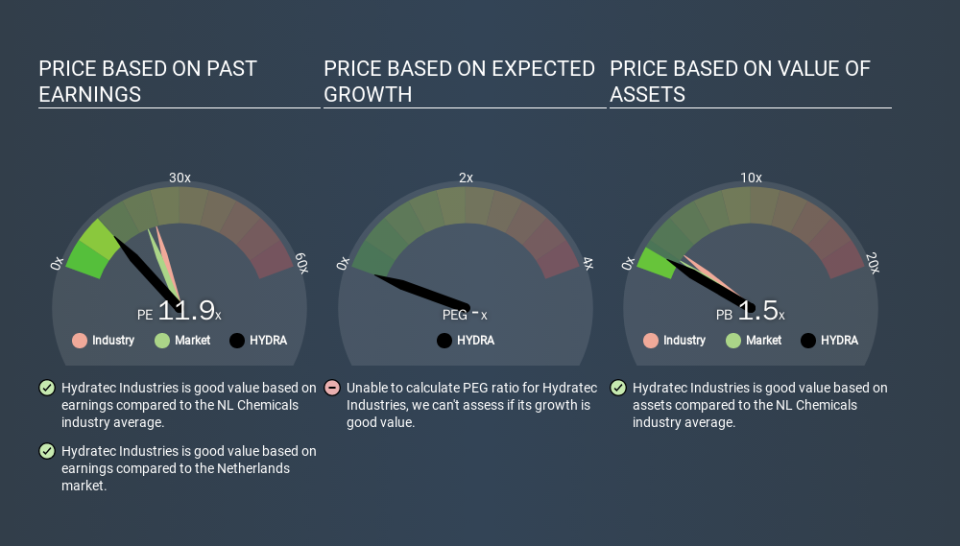
This article is for investors who would like to improve their understanding of price to earnings ratios (P/E ratios). We'll look at Hydratec Industries NV's (AMS:HYDRA) P/E ratio and reflect on what it tells us about the company's share price. Looking at earnings over the last twelve months, Hydratec Industries has a P/E ratio of 11.85. That corresponds to an earnings yield of approximately 8.4%.
See our latest analysis for Hydratec Industries
How Do You Calculate A P/E Ratio?
The formula for price to earnings is:
Price to Earnings Ratio = Share Price ÷ Earnings per Share (EPS)
Or for Hydratec Industries:
P/E of 11.85 = €67.50 ÷ €5.70 (Based on the year to June 2019.)
Is A High Price-to-Earnings Ratio Good?
A higher P/E ratio means that investors are paying a higher price for each €1 of company earnings. That isn't necessarily good or bad, but a high P/E implies relatively high expectations of what a company can achieve in the future.
Does Hydratec Industries Have A Relatively High Or Low P/E For Its Industry?
One good way to get a quick read on what market participants expect of a company is to look at its P/E ratio. If you look at the image below, you can see Hydratec Industries has a lower P/E than the average (23.5) in the chemicals industry classification.
Its relatively low P/E ratio indicates that Hydratec Industries shareholders think it will struggle to do as well as other companies in its industry classification. Many investors like to buy stocks when the market is pessimistic about their prospects. You should delve deeper. I like to check if company insiders have been buying or selling.
How Growth Rates Impact P/E Ratios
Companies that shrink earnings per share quickly will rapidly decrease the 'E' in the equation. That means even if the current P/E is low, it will increase over time if the share price stays flat. So while a stock may look cheap based on past earnings, it could be expensive based on future earnings.
Hydratec Industries shrunk earnings per share by 26% over the last year. But it has grown its earnings per share by 9.7% per year over the last five years. And EPS is down 6.7% a year, over the last 3 years. This could justify a low P/E.
Remember: P/E Ratios Don't Consider The Balance Sheet
The 'Price' in P/E reflects the market capitalization of the company. So it won't reflect the advantage of cash, or disadvantage of debt. The exact same company would hypothetically deserve a higher P/E ratio if it had a strong balance sheet, than if it had a weak one with lots of debt, because a cashed up company can spend on growth.
Such spending might be good or bad, overall, but the key point here is that you need to look at debt to understand the P/E ratio in context.
How Does Hydratec Industries's Debt Impact Its P/E Ratio?
Hydratec Industries has net debt equal to 38% of its market cap. While it's worth keeping this in mind, it isn't a worry.
The Verdict On Hydratec Industries's P/E Ratio
Hydratec Industries's P/E is 11.9 which is below average (20.7) in the NL market. With only modest debt, it's likely the lack of EPS growth at least partially explains the pessimism implied by the P/E ratio.
Investors have an opportunity when market expectations about a stock are wrong. If it is underestimating a company, investors can make money by buying and holding the shares until the market corrects itself. Although we don't have analyst forecasts shareholders might want to examine this detailed historical graph of earnings, revenue and cash flow.
You might be able to find a better buy than Hydratec Industries. If you want a selection of possible winners, check out this free list of interesting companies that trade on a P/E below 20 (but have proven they can grow earnings).
If you spot an error that warrants correction, please contact the editor at editorial-team@simplywallst.com. This article by Simply Wall St is general in nature. It does not constitute a recommendation to buy or sell any stock, and does not take account of your objectives, or your financial situation. Simply Wall St has no position in the stocks mentioned.
We aim to bring you long-term focused research analysis driven by fundamental data. Note that our analysis may not factor in the latest price-sensitive company announcements or qualitative material. Thank you for reading.
