Does Innodata Inc’s (NASDAQ:INOD) Earnings Growth Make It An Outperformer?

Analyzing Innodata Inc’s (NASDAQ:INOD) track record of past performance is a valuable exercise for investors. It enables us to reflect on whether or not the company has met expectations, which is a powerful signal for future performance. Today I will assess INOD’s recent performance announced on 31 March 2018 and compare these figures to its long-term trend and industry movements. Check out our latest analysis for Innodata
How Well Did INOD Perform?
For the purpose of this commentary, I like to use data from the most recent 12 months, which either annualizes the most recent 6-month earnings update, or in some cases, the most recent annual report is already the latest available financial data. This method allows me to assess different stocks in a uniform manner using the most relevant data points. For Innodata, its latest earnings (trailing twelve month) is -US$3.59M, which compared to the previous year’s figure, has become less negative. Given that these values are fairly short-term thinking, I have estimated an annualized five-year figure for Innodata’s earnings, which stands at -US$1.59M. This means Innodata has historically performed better than recently, while it seems like earnings are now heading back towards to right direction again.
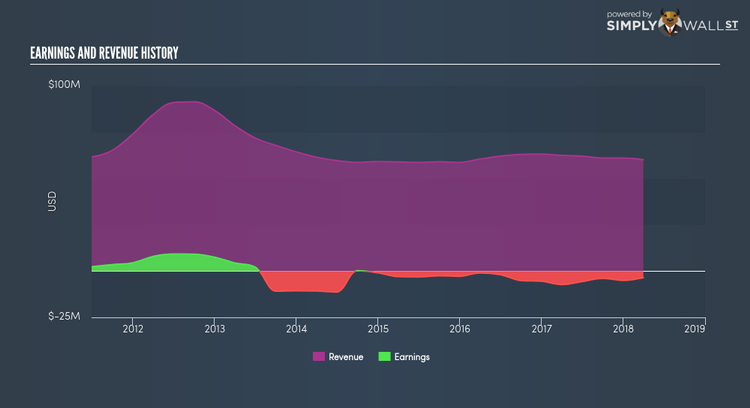
We can further examine Innodata’s loss by looking at what the industry has been experiencing over the past few years. Each year, for the past five years Innodata has seen an annual decline in revenue of -4.55%, on average. This adverse movement is a driver of the company’s inability to reach breakeven. Has the entire industry experienced this headwind? Inspecting growth from a sector-level, the US it industry has been growing its average earnings by double-digit 14.68% over the prior year, and 11.86% over the past five. This shows that, despite the fact that Innodata is currently unprofitable, it may have been aided by industry tailwinds, moving earnings towards to right direction.
What does this mean?
Innodata’s track record can be a valuable insight into its earnings performance, but it certainly doesn’t tell the whole story. Companies that incur net loss is always hard to predict what will occur going forward, and when. The most valuable step is to assess company-specific issues Innodata may be facing and whether management guidance has regularly been met in the past. You should continue to research Innodata to get a better picture of the stock by looking at:
Financial Health: Is INOD’s operations financially sustainable? Balance sheets can be hard to analyze, which is why we’ve done it for you. Check out our financial health checks here.
Valuation: What is INOD worth today? Is the stock undervalued, even when its growth outlook is factored into its intrinsic value? The intrinsic value infographic in our free research report helps visualize whether INOD is currently mispriced by the market.
Other High-Performing Stocks: Are there other stocks that provide better prospects with proven track records? Explore our free list of these great stocks here.
NB: Figures in this article are calculated using data from the trailing twelve months from 31 March 2018. This may not be consistent with full year annual report figures.
To help readers see pass the short term volatility of the financial market, we aim to bring you a long-term focused research analysis purely driven by fundamental data. Note that our analysis does not factor in the latest price sensitive company announcements.
The author is an independent contributor and at the time of publication had no position in the stocks mentioned.
