Does JLT Mobile Computers AB (publ) (STO:JLT) Have A Good P/E Ratio?

This article is for investors who would like to improve their understanding of price to earnings ratios (P/E ratios). To keep it practical, we'll show how JLT Mobile Computers AB (publ)'s (STO:JLT) P/E ratio could help you assess the value on offer. What is JLT Mobile Computers's P/E ratio? Well, based on the last twelve months it is 18.88. In other words, at today's prices, investors are paying SEK18.88 for every SEK1 in prior year profit.
Check out our latest analysis for JLT Mobile Computers
How Do I Calculate A Price To Earnings Ratio?
The formula for P/E is:
Price to Earnings Ratio = Share Price ÷ Earnings per Share (EPS)
Or for JLT Mobile Computers:
P/E of 18.88 = SEK7 ÷ SEK0.37 (Based on the trailing twelve months to March 2019.)
Is A High P/E Ratio Good?
A higher P/E ratio means that investors are paying a higher price for each SEK1 of company earnings. That isn't necessarily good or bad, but a high P/E implies relatively high expectations of what a company can achieve in the future.
Does JLT Mobile Computers Have A Relatively High Or Low P/E For Its Industry?
We can get an indication of market expectations by looking at the P/E ratio. The image below shows that JLT Mobile Computers has a lower P/E than the average (22.5) P/E for companies in the tech industry.
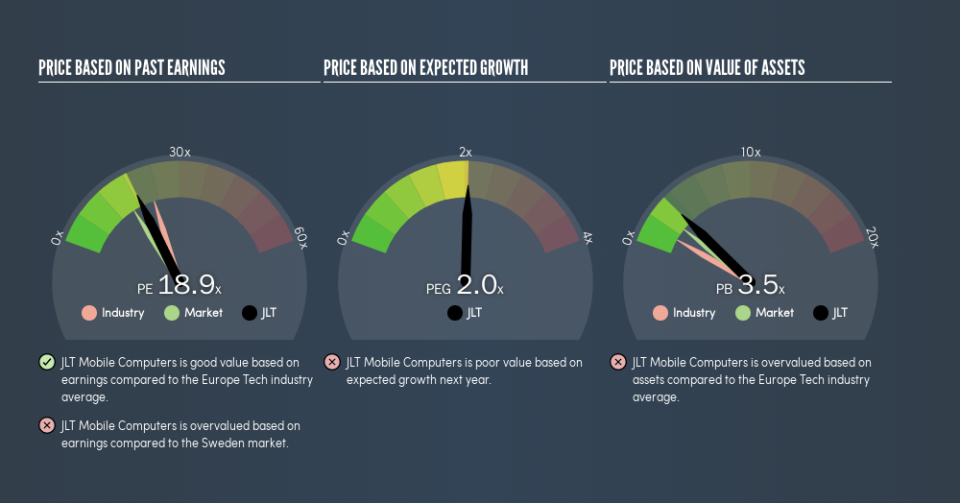
JLT Mobile Computers's P/E tells us that market participants think it will not fare as well as its peers in the same industry. Many investors like to buy stocks when the market is pessimistic about their prospects. It is arguably worth checking if insiders are buying shares, because that might imply they believe the stock is undervalued.
How Growth Rates Impact P/E Ratios
P/E ratios primarily reflect market expectations around earnings growth rates. Earnings growth means that in the future the 'E' will be higher. That means even if the current P/E is high, it will reduce over time if the share price stays flat. A lower P/E should indicate the stock is cheap relative to others -- and that may attract buyers.
JLT Mobile Computers increased earnings per share by a whopping 41% last year. And it has bolstered its earnings per share by 21% per year over the last five years. With that performance, I would expect it to have an above average P/E ratio.
A Limitation: P/E Ratios Ignore Debt and Cash In The Bank
Don't forget that the P/E ratio considers market capitalization. In other words, it does not consider any debt or cash that the company may have on the balance sheet. In theory, a company can lower its future P/E ratio by using cash or debt to invest in growth.
Such spending might be good or bad, overall, but the key point here is that you need to look at debt to understand the P/E ratio in context.
How Does JLT Mobile Computers's Debt Impact Its P/E Ratio?
JLT Mobile Computers has net cash of kr50m. This is fairly high at 25% of its market capitalization. That might mean balance sheet strength is important to the business, but should also help push the P/E a bit higher than it would otherwise be.
The Bottom Line On JLT Mobile Computers's P/E Ratio
JLT Mobile Computers's P/E is 18.9 which is above average (16.2) in its market. The excess cash it carries is the gravy on top its fast EPS growth. So based on this analysis we'd expect JLT Mobile Computers to have a high P/E ratio.
Investors have an opportunity when market expectations about a stock are wrong. People often underestimate remarkable growth -- so investors can make money when fast growth is not fully appreciated. So this free report on the analyst consensus forecasts could help you make a master move on this stock.
But note: JLT Mobile Computers may not be the best stock to buy. So take a peek at this free list of interesting companies with strong recent earnings growth (and a P/E ratio below 20).
We aim to bring you long-term focused research analysis driven by fundamental data. Note that our analysis may not factor in the latest price-sensitive company announcements or qualitative material.
If you spot an error that warrants correction, please contact the editor at editorial-team@simplywallst.com. This article by Simply Wall St is general in nature. It does not constitute a recommendation to buy or sell any stock, and does not take account of your objectives, or your financial situation. Simply Wall St has no position in the stocks mentioned. Thank you for reading.
