Does Juniper Networks, Inc.'s (NYSE:JNPR) P/E Ratio Signal A Buying Opportunity?

This article is for investors who would like to improve their understanding of price to earnings ratios (P/E ratios). We'll look at Juniper Networks, Inc.'s (NYSE:JNPR) P/E ratio and reflect on what it tells us about the company's share price. Based on the last twelve months, Juniper Networks's P/E ratio is 15.51. That means that at current prices, buyers pay $15.51 for every $1 in trailing yearly profits.
Want to participate in a short research study? Help shape the future of investing tools and you could win a $250 gift card!
Check out our latest analysis for Juniper Networks
How Do I Calculate A Price To Earnings Ratio?
The formula for price to earnings is:
Price to Earnings Ratio = Price per Share ÷ Earnings per Share (EPS)
Or for Juniper Networks:
P/E of 15.51 = $25.18 ÷ $1.62 (Based on the trailing twelve months to March 2019.)
Is A High Price-to-Earnings Ratio Good?
A higher P/E ratio means that buyers have to pay a higher price for each $1 the company has earned over the last year. That is not a good or a bad thing per se, but a high P/E does imply buyers are optimistic about the future.
How Growth Rates Impact P/E Ratios
If earnings fall then in the future the 'E' will be lower. That means unless the share price falls, the P/E will increase in a few years. A higher P/E should indicate the stock is expensive relative to others -- and that may encourage shareholders to sell.
Juniper Networks's earnings made like a rocket, taking off 160% last year. On the other hand, the longer term performance is poor, with EPS down -12% per year over 3 years.
Does Juniper Networks Have A Relatively High Or Low P/E For Its Industry?
The P/E ratio essentially measures market expectations of a company. The image below shows that Juniper Networks has a lower P/E than the average (28.8) P/E for companies in the communications industry.
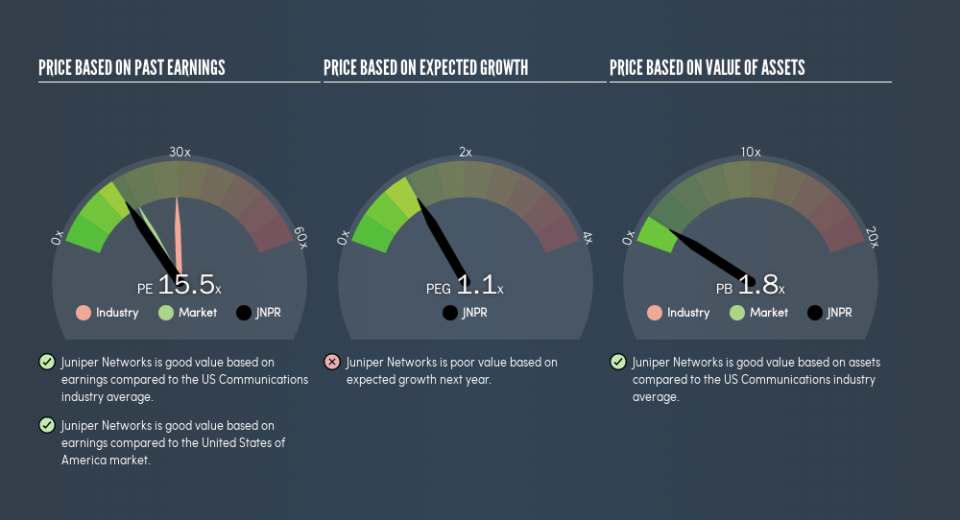
Its relatively low P/E ratio indicates that Juniper Networks shareholders think it will struggle to do as well as other companies in its industry classification. Since the market seems unimpressed with Juniper Networks, it's quite possible it could surprise on the upside. If you consider the stock interesting, further research is recommended. For example, I often monitor director buying and selling.
Remember: P/E Ratios Don't Consider The Balance Sheet
Don't forget that the P/E ratio considers market capitalization. Thus, the metric does not reflect cash or debt held by the company. Theoretically, a business can improve its earnings (and produce a lower P/E in the future) by investing in growth. That means taking on debt (or spending its cash).
Spending on growth might be good or bad a few years later, but the point is that the P/E ratio does not account for the option (or lack thereof).
So What Does Juniper Networks's Balance Sheet Tell Us?
Juniper Networks has net cash of US$1.4b. This is fairly high at 16% of its market capitalization. That might mean balance sheet strength is important to the business, but should also help push the P/E a bit higher than it would otherwise be.
The Verdict On Juniper Networks's P/E Ratio
Juniper Networks has a P/E of 15.5. That's below the average in the US market, which is 17.7. The net cash position gives plenty of options to the business, and the recent improvement in EPS is good to see. One might conclude that the market is a bit pessimistic, given the low P/E ratio.
When the market is wrong about a stock, it gives savvy investors an opportunity. If it is underestimating a company, investors can make money by buying and holding the shares until the market corrects itself. So this free report on the analyst consensus forecasts could help you make a master move on this stock.
But note: Juniper Networks may not be the best stock to buy. So take a peek at this free list of interesting companies with strong recent earnings growth (and a P/E ratio below 20).
We aim to bring you long-term focused research analysis driven by fundamental data. Note that our analysis may not factor in the latest price-sensitive company announcements or qualitative material.
If you spot an error that warrants correction, please contact the editor at editorial-team@simplywallst.com. This article by Simply Wall St is general in nature. It does not constitute a recommendation to buy or sell any stock, and does not take account of your objectives, or your financial situation. Simply Wall St has no position in the stocks mentioned. Thank you for reading.
