Does Lockheed Martin Corporation's (NYSE:LMT) P/E Ratio Signal A Buying Opportunity?

This article is written for those who want to get better at using price to earnings ratios (P/E ratios). We'll look at Lockheed Martin Corporation's (NYSE:LMT) P/E ratio and reflect on what it tells us about the company's share price. What is Lockheed Martin's P/E ratio? Well, based on the last twelve months it is 18.7. That corresponds to an earnings yield of approximately 5.3%.
See our latest analysis for Lockheed Martin
How Do You Calculate Lockheed Martin's P/E Ratio?
The formula for price to earnings is:
Price to Earnings Ratio = Share Price ÷ Earnings per Share (EPS)
Or for Lockheed Martin:
P/E of 18.7 = $386.56 ÷ $20.67 (Based on the trailing twelve months to June 2019.)
Is A High Price-to-Earnings Ratio Good?
A higher P/E ratio implies that investors pay a higher price for the earning power of the business. That isn't a good or a bad thing on its own, but a high P/E means that buyers have a higher opinion of the business's prospects, relative to stocks with a lower P/E.
How Does Lockheed Martin's P/E Ratio Compare To Its Peers?
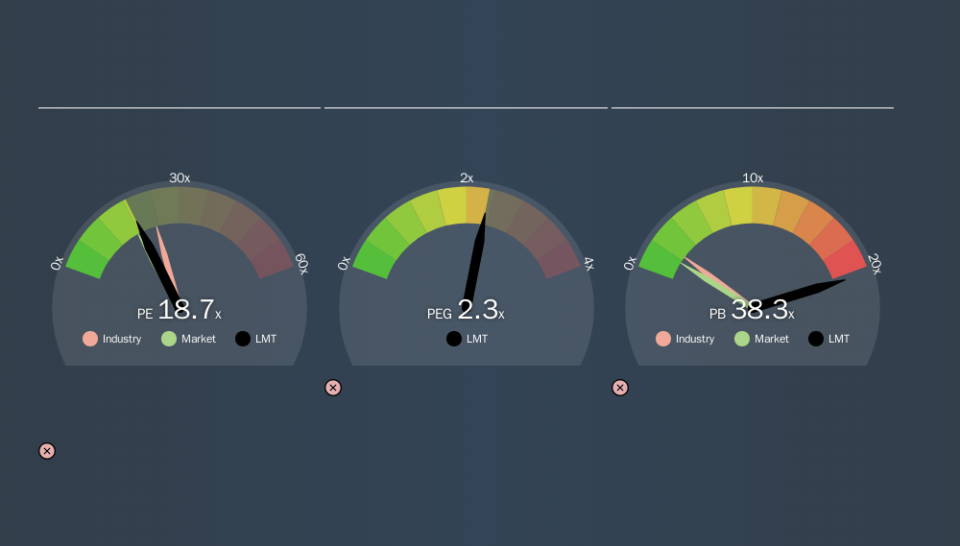
The P/E ratio essentially measures market expectations of a company. The image below shows that Lockheed Martin has a lower P/E than the average (23.3) P/E for companies in the aerospace & defense industry.
Lockheed Martin's P/E tells us that market participants think it will not fare as well as its peers in the same industry. Since the market seems unimpressed with Lockheed Martin, it's quite possible it could surprise on the upside. If you consider the stock interesting, further research is recommended. For example, I often monitor director buying and selling.
How Growth Rates Impact P/E Ratios
P/E ratios primarily reflect market expectations around earnings growth rates. That's because companies that grow earnings per share quickly will rapidly increase the 'E' in the equation. Therefore, even if you pay a high multiple of earnings now, that multiple will become lower in the future. So while a stock may look expensive based on past earnings, it could be cheap based on future earnings.
Lockheed Martin's earnings made like a rocket, taking off 136% last year. The cherry on top is that the five year growth rate was an impressive 16% per year. So I'd be surprised if the P/E ratio was not above average.
Don't Forget: The P/E Does Not Account For Debt or Bank Deposits
The 'Price' in P/E reflects the market capitalization of the company. That means it doesn't take debt or cash into account. In theory, a company can lower its future P/E ratio by using cash or debt to invest in growth.
Such spending might be good or bad, overall, but the key point here is that you need to look at debt to understand the P/E ratio in context.
Is Debt Impacting Lockheed Martin's P/E?
Lockheed Martin has net debt worth 11% of its market capitalization. That's enough debt to impact the P/E ratio a little; so keep it in mind if you're comparing it to companies without debt.
The Bottom Line On Lockheed Martin's P/E Ratio
Lockheed Martin's P/E is 18.7 which is about average (17.5) in the US market. Given it has reasonable debt levels, and grew earnings strongly last year, the P/E indicates the market has doubts this growth can be sustained. Given analysts are expecting further growth, one might have expected a higher P/E ratio. That may be worth further research.
Investors should be looking to buy stocks that the market is wrong about. As value investor Benjamin Graham famously said, 'In the short run, the market is a voting machine but in the long run, it is a weighing machine.' So this free visualization of the analyst consensus on future earnings could help you make the right decision about whether to buy, sell, or hold.
Of course, you might find a fantastic investment by looking at a few good candidates. So take a peek at this free list of companies with modest (or no) debt, trading on a P/E below 20.
We aim to bring you long-term focused research analysis driven by fundamental data. Note that our analysis may not factor in the latest price-sensitive company announcements or qualitative material.
If you spot an error that warrants correction, please contact the editor at editorial-team@simplywallst.com. This article by Simply Wall St is general in nature. It does not constitute a recommendation to buy or sell any stock, and does not take account of your objectives, or your financial situation. Simply Wall St has no position in the stocks mentioned. Thank you for reading.
