Does Lonking Holdings Limited (HKG:3339) Have A Good P/E Ratio?

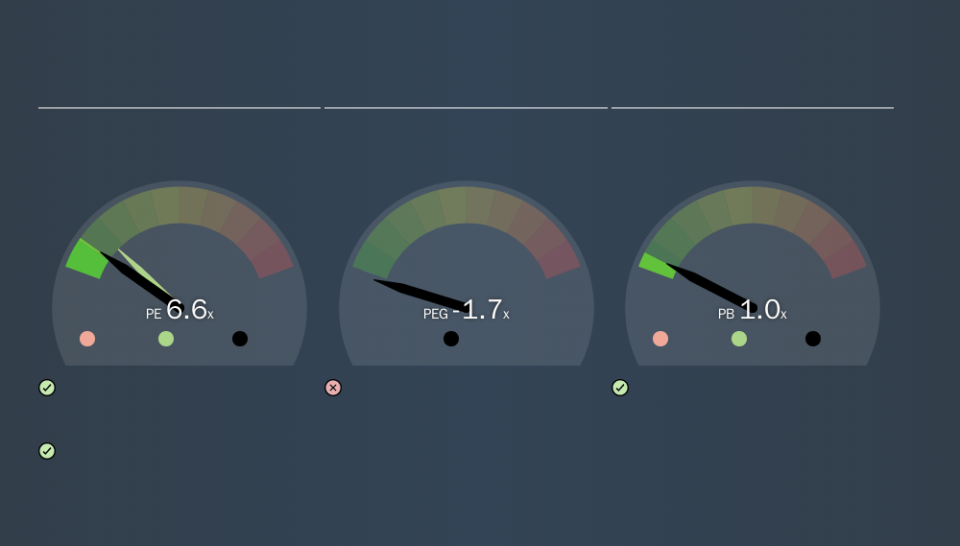
This article is for investors who would like to improve their understanding of price to earnings ratios (P/E ratios). We'll show how you can use Lonking Holdings Limited's (HKG:3339) P/E ratio to inform your assessment of the investment opportunity. Lonking Holdings has a price to earnings ratio of 6.56, based on the last twelve months. In other words, at today's prices, investors are paying HK$6.56 for every HK$1 in prior year profit.
View our latest analysis for Lonking Holdings
How Do You Calculate A P/E Ratio?
The formula for P/E is:
Price to Earnings Ratio = Share Price (in reporting currency) ÷ Earnings per Share (EPS)
Or for Lonking Holdings:
P/E of 6.56 = HK$2.04 (Note: this is the share price in the reporting currency, namely, CNY ) ÷ HK$0.31 (Based on the trailing twelve months to June 2019.)
Is A High Price-to-Earnings Ratio Good?
A higher P/E ratio implies that investors pay a higher price for the earning power of the business. That is not a good or a bad thing per se, but a high P/E does imply buyers are optimistic about the future.
How Does Lonking Holdings's P/E Ratio Compare To Its Peers?
We can get an indication of market expectations by looking at the P/E ratio. We can see in the image below that the average P/E (10.2) for companies in the machinery industry is higher than Lonking Holdings's P/E.
Lonking Holdings's P/E tells us that market participants think it will not fare as well as its peers in the same industry. Many investors like to buy stocks when the market is pessimistic about their prospects. You should delve deeper. I like to check if company insiders have been buying or selling.
How Growth Rates Impact P/E Ratios
Probably the most important factor in determining what P/E a company trades on is the earnings growth. If earnings are growing quickly, then the 'E' in the equation will increase faster than it would otherwise. Therefore, even if you pay a high multiple of earnings now, that multiple will become lower in the future. A lower P/E should indicate the stock is cheap relative to others -- and that may attract buyers.
Lonking Holdings saw earnings per share improve by -6.1% last year. And it has bolstered its earnings per share by 22% per year over the last five years.
Don't Forget: The P/E Does Not Account For Debt or Bank Deposits
The 'Price' in P/E reflects the market capitalization of the company. In other words, it does not consider any debt or cash that the company may have on the balance sheet. The exact same company would hypothetically deserve a higher P/E ratio if it had a strong balance sheet, than if it had a weak one with lots of debt, because a cashed up company can spend on growth.
Such spending might be good or bad, overall, but the key point here is that you need to look at debt to understand the P/E ratio in context.
So What Does Lonking Holdings's Balance Sheet Tell Us?
With net cash of CN¥3.6b, Lonking Holdings has a very strong balance sheet, which may be important for its business. Having said that, at 42% of its market capitalization the cash hoard would contribute towards a higher P/E ratio.
The Bottom Line On Lonking Holdings's P/E Ratio
Lonking Holdings has a P/E of 6.6. That's below the average in the HK market, which is 10.2. Recent earnings growth wasn't bad. And the net cash position gives the company many options. So it's strange that the low P/E indicates low expectations.
When the market is wrong about a stock, it gives savvy investors an opportunity. If it is underestimating a company, investors can make money by buying and holding the shares until the market corrects itself. So this free report on the analyst consensus forecasts could help you make a master move on this stock.
Of course you might be able to find a better stock than Lonking Holdings. So you may wish to see this free collection of other companies that have grown earnings strongly.
We aim to bring you long-term focused research analysis driven by fundamental data. Note that our analysis may not factor in the latest price-sensitive company announcements or qualitative material.
If you spot an error that warrants correction, please contact the editor at editorial-team@simplywallst.com. This article by Simply Wall St is general in nature. It does not constitute a recommendation to buy or sell any stock, and does not take account of your objectives, or your financial situation. Simply Wall St has no position in the stocks mentioned. Thank you for reading.
