How Does Man Wah Holdings's (HKG:1999) P/E Compare To Its Industry, After Its Big Share Price Gain?

Man Wah Holdings (HKG:1999) shareholders are no doubt pleased to see that the share price has bounced 32% in the last month alone, although it is still down 13% over the last quarter. That brought the twelve month gain to a very sharp 52%.
All else being equal, a sharp share price increase should make a stock less attractive to potential investors. While the market sentiment towards a stock is very changeable, in the long run, the share price will tend to move in the same direction as earnings per share. So some would prefer to hold off buying when there is a lot of optimism towards a stock. One way to gauge market expectations of a stock is to look at its Price to Earnings Ratio (PE Ratio). A high P/E ratio means that investors have a high expectation about future growth, while a low P/E ratio means they have low expectations about future growth.
View our latest analysis for Man Wah Holdings
Does Man Wah Holdings Have A Relatively High Or Low P/E For Its Industry?
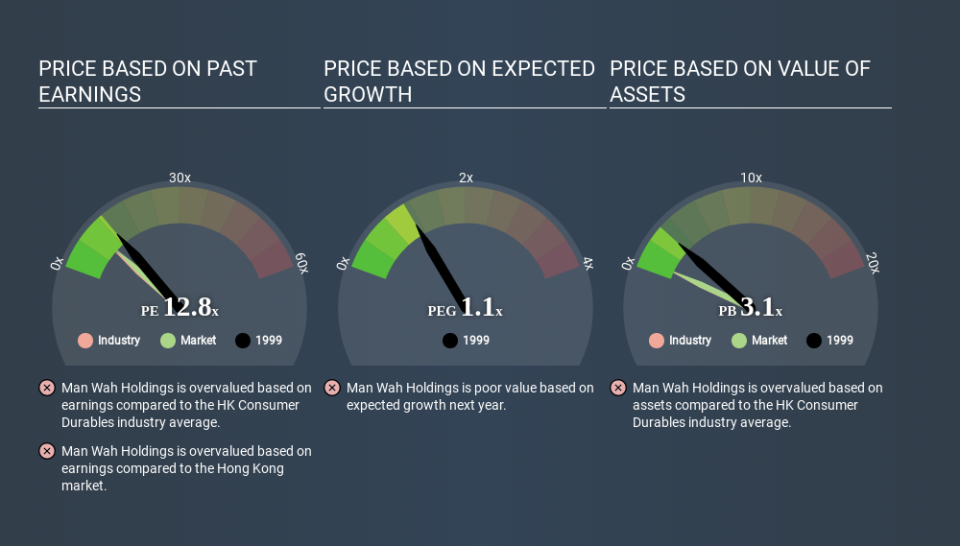
Man Wah Holdings's P/E of 12.82 indicates some degree of optimism towards the stock. You can see in the image below that the average P/E (9.2) for companies in the consumer durables industry is lower than Man Wah Holdings's P/E.
Man Wah Holdings's P/E tells us that market participants think the company will perform better than its industry peers, going forward. The market is optimistic about the future, but that doesn't guarantee future growth. So further research is always essential. I often monitor director buying and selling.
How Growth Rates Impact P/E Ratios
Companies that shrink earnings per share quickly will rapidly decrease the 'E' in the equation. That means unless the share price falls, the P/E will increase in a few years. Then, a higher P/E might scare off shareholders, pushing the share price down.
Man Wah Holdings increased earnings per share by an impressive 20% over the last twelve months. And earnings per share have improved by 9.0% annually, over the last five years. With that performance, you might expect an above average P/E ratio. Unfortunately, earnings per share are down 2.1% a year, over 3 years.
Don't Forget: The P/E Does Not Account For Debt or Bank Deposits
Don't forget that the P/E ratio considers market capitalization. That means it doesn't take debt or cash into account. In theory, a company can lower its future P/E ratio by using cash or debt to invest in growth.
Such spending might be good or bad, overall, but the key point here is that you need to look at debt to understand the P/E ratio in context.
Man Wah Holdings's Balance Sheet
Man Wah Holdings's net debt is 8.4% of its market cap. So it doesn't have as many options as it would with net cash, but its debt would not have much of an impact on its P/E ratio.
The Bottom Line On Man Wah Holdings's P/E Ratio
Man Wah Holdings trades on a P/E ratio of 12.8, which is above its market average of 9.7. The company is not overly constrained by its modest debt levels, and its recent EPS growth very solid. Therefore, it's not particularly surprising that it has a above average P/E ratio. What is very clear is that the market has become more optimistic about Man Wah Holdings over the last month, with the P/E ratio rising from 9.7 back then to 12.8 today. For those who prefer to invest with the flow of momentum, that might mean it's time to put the stock on a watchlist, or research it. But the contrarian may see it as a missed opportunity.
When the market is wrong about a stock, it gives savvy investors an opportunity. People often underestimate remarkable growth -- so investors can make money when fast growth is not fully appreciated. So this free visualization of the analyst consensus on future earnings could help you make the right decision about whether to buy, sell, or hold.
Of course, you might find a fantastic investment by looking at a few good candidates. So take a peek at this free list of companies with modest (or no) debt, trading on a P/E below 20.
If you spot an error that warrants correction, please contact the editor at editorial-team@simplywallst.com. This article by Simply Wall St is general in nature. It does not constitute a recommendation to buy or sell any stock, and does not take account of your objectives, or your financial situation. Simply Wall St has no position in the stocks mentioned.
We aim to bring you long-term focused research analysis driven by fundamental data. Note that our analysis may not factor in the latest price-sensitive company announcements or qualitative material. Thank you for reading.
