Does The Market Have A Low Tolerance For JBG SMITH Properties' (NYSE:JBGS) Mixed Fundamentals?

JBG SMITH Properties (NYSE:JBGS) has had a rough three months with its share price down 13%. We, however decided to study the company's financials to determine if they have got anything to do with the price decline. Fundamentals usually dictate market outcomes so it makes sense to study the company's financials. Specifically, we decided to study JBG SMITH Properties' ROE in this article.
Return on Equity or ROE is a test of how effectively a company is growing its value and managing investors’ money. In short, ROE shows the profit each dollar generates with respect to its shareholder investments.
View our latest analysis for JBG SMITH Properties
How Is ROE Calculated?
Return on equity can be calculated by using the formula:
Return on Equity = Net Profit (from continuing operations) ÷ Shareholders' Equity
So, based on the above formula, the ROE for JBG SMITH Properties is:
2.4% = US$94m ÷ US$4.0b (Based on the trailing twelve months to March 2020).
The 'return' is the yearly profit. One way to conceptualize this is that for each $1 of shareholders' capital it has, the company made $0.02 in profit.
Why Is ROE Important For Earnings Growth?
We have already established that ROE serves as an efficient profit-generating gauge for a company's future earnings. Based on how much of its profits the company chooses to reinvest or "retain", we are then able to evaluate a company's future ability to generate profits. Assuming everything else remains unchanged, the higher the ROE and profit retention, the higher the growth rate of a company compared to companies that don't necessarily bear these characteristics.
A Side By Side comparison of JBG SMITH Properties' Earnings Growth And 2.4% ROE
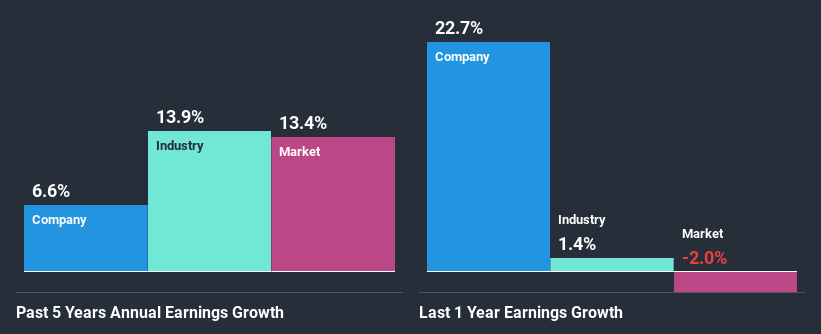
It is quite clear that JBG SMITH Properties' ROE is rather low. Even when compared to the industry average of 5.2%, the ROE figure is pretty disappointing. JBG SMITH Properties was still able to see a decent net income growth of 6.6% over the past five years. Therefore, the growth in earnings could probably have been caused by other variables. For example, it is possible that the company's management has made some good strategic decisions, or that the company has a low payout ratio.
We then compared JBG SMITH Properties' net income growth with the industry and found that the company's growth figure is lower than the average industry growth rate of 14% in the same period, which is a bit concerning.
The basis for attaching value to a company is, to a great extent, tied to its earnings growth. What investors need to determine next is if the expected earnings growth, or the lack of it, is already built into the share price. Doing so will help them establish if the stock's future looks promising or ominous. Is JBGS fairly valued? This infographic on the company's intrinsic value has everything you need to know.
Is JBG SMITH Properties Making Efficient Use Of Its Profits?
JBG SMITH Properties seems to be paying out most of its income as dividends judging by its three-year median payout ratio of 70%, meaning the company retains only 30% of its income. However, this is typical for REITs as they are often required by law to distribute most of their earnings. Despite this, the company's earnings grew moderately as we saw above.
Moreover, JBG SMITH Properties is determined to keep sharing its profits with shareholders which we infer from its long history of three years of paying a dividend.
Conclusion
In total, we're a bit ambivalent about JBG SMITH Properties' performance. While the company has posted a decent earnings growth, We do feel that the earnings growth number could have been even higher, had the company been reinvesting more of its earnings at a higher rate of return. That being so, according to the latest industry analyst forecasts, the company's earnings are expected to shrink in the future. To know more about the latest analysts predictions for the company, check out this visualization of analyst forecasts for the company.
This article by Simply Wall St is general in nature. It does not constitute a recommendation to buy or sell any stock, and does not take account of your objectives, or your financial situation. We aim to bring you long-term focused analysis driven by fundamental data. Note that our analysis may not factor in the latest price-sensitive company announcements or qualitative material. Simply Wall St has no position in any stocks mentioned.
Have feedback on this article? Concerned about the content? Get in touch with us directly. Alternatively, email editorial-team@simplywallst.com.
