Does Mercator Medical SA.’s (WSE:MRC) PE Ratio Warrant A Buy?

Mercator Medical SA. (WSE:MRC) trades with a trailing P/E of 32.5x, which is lower than the industry average of 32.6x. Although some investors may jump to the conclusion that this is a great buying opportunity, understanding the assumptions behind the P/E ratio might change your mind. In this article, I will explain what the P/E ratio is as well as what you should look out for when using it. View our latest analysis for Mercator Medical
Breaking down the Price-Earnings ratio
The P/E ratio is a popular ratio used in relative valuation since earnings power is a key driver of investment value. By comparing a stock’s price per share to its earnings per share, we are able to see how much investors are paying for each dollar of the company’s earnings.
P/E Calculation for MRC
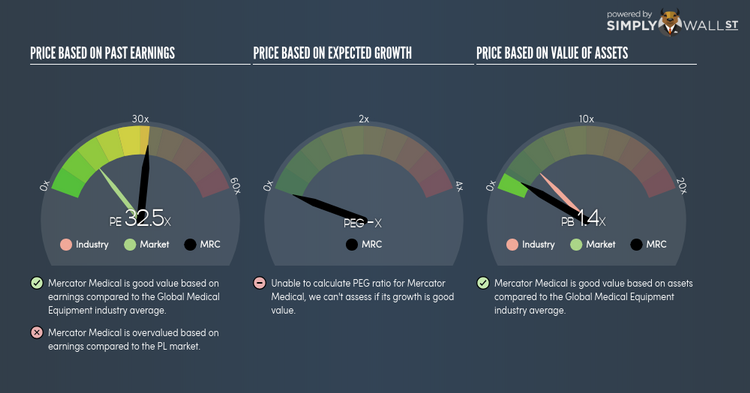
Price-Earnings Ratio = Price per share ÷ Earnings per share
MRC Price-Earnings Ratio = PLN16.1 ÷ PLN0.496 = 32.5x
On its own, the P/E ratio doesn’t tell you much; however, it becomes extremely useful when you compare it with other similar companies. We preferably want to compare the stock’s P/E ratio to the average of companies that have similar features to MRC, such as capital structure and profitability. One way of gathering a peer group is to use firms in the same industry, which is what I’ll do. At 32.5x, MRC’s P/E is lower than its industry peers (32.6x). This implies that investors are undervaluing each dollar of MRC’s earnings. As such, our analysis shows that MRC represents an under-priced stock.
Assumptions to watch out for
While our conclusion might prompt you to buy MRC immediately, there are two important assumptions you should be aware of. Firstly, our peer group contains companies that are similar to MRC. If this isn’t the case, the difference in P/E could be due to other factors. For example, if you compared higher growth firms with MRC, then its P/E would naturally be lower since investors would reward its peers’ higher growth with a higher price. The second assumption that must hold true is that the stocks we are comparing MRC to are fairly valued by the market. If this does not hold true, MRC’s lower P/E ratio may be because firms in our peer group are overvalued by the market.
To help readers see pass the short term volatility of the financial market, we aim to bring you a long-term focused research analysis purely driven by fundamental data. Note that our analysis does not factor in the latest price sensitive company announcements.
The author is an independent contributor and at the time of publication had no position in the stocks mentioned.
