How Does Midwich Group Plc (LON:MIDW) Fare As A Dividend Stock?

Dividend paying stocks like Midwich Group Plc (LON:MIDW) tend to be popular with investors, and for good reason - some research suggests a significant amount of all stock market returns come from reinvested dividends. If you are hoping to live on the income from dividends, it's important to be a lot more stringent with your investments than the average punter.
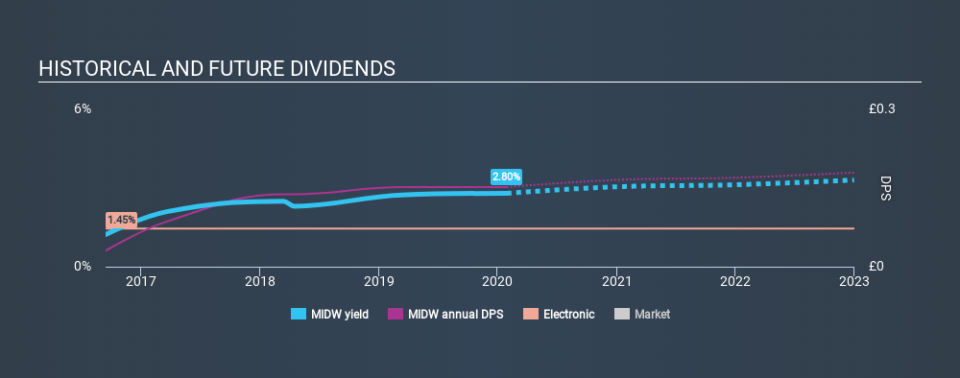
Some readers mightn't know much about Midwich Group's 2.8% dividend, as it has only been paying distributions for the last three years. While it may not look like much, if earnings are growing it could become quite interesting. Some simple research can reduce the risk of buying Midwich Group for its dividend - read on to learn more.
Explore this interactive chart for our latest analysis on Midwich Group!
Payout ratios
Dividends are usually paid out of company earnings. If a company is paying more than it earns, then the dividend might become unsustainable - hardly an ideal situation. As a result, we should always investigate whether a company can afford its dividend, measured as a percentage of a company's net income after tax. In the last year, Midwich Group paid out 84% of its profit as dividends. Paying out a majority of its earnings limits the amount that can be reinvested in the business. This may indicate a commitment to paying a dividend, or a dearth of investment opportunities.
Another important check we do is to see if the free cash flow generated is sufficient to pay the dividend. The company paid out 57% of its free cash flow, which is not bad per se, but does start to limit the amount of cash Midwich Group has available to meet other needs. It's positive to see that Midwich Group's dividend is covered by both profits and cash flow, since this is generally a sign that the dividend is sustainable, and a lower payout ratio usually suggests a greater margin of safety before the dividend gets cut.
Is Midwich Group's Balance Sheet Risky?
As Midwich Group has a meaningful amount of debt, we need to check its balance sheet to see if the company might have debt risks. A rough way to check this is with these two simple ratios: a) net debt divided by EBITDA (earnings before interest, tax, depreciation and amortisation), and b) net interest cover. Net debt to EBITDA measures total debt load relative to company earnings (lower = less debt), while net interest cover measures the ability to pay interest on the debt (higher = greater ability to pay interest costs). Midwich Group has net debt of 2.24 times its EBITDA. Using debt can accelerate business growth, but also increases the risks.
Net interest cover can be calculated by dividing earnings before interest and tax (EBIT) by the company's net interest expense. Midwich Group has interest cover of more than 12 times its interest expense, which we think is quite strong.
We update our data on Midwich Group every 24 hours, so you can always get our latest analysis of its financial health, here.
Dividend Volatility
From the perspective of an income investor who wants to earn dividends for many years, there is not much point buying a stock if its dividend is regularly cut or is not reliable. The company has been paying a stable dividend for a few years now, but we'd like to see more evidence of consistency over a longer period. During the past three-year period, the first annual payment was UK£0.031 in 2017, compared to UK£0.15 last year. Dividends per share have grown at approximately 71% per year over this time.
Midwich Group has been growing its dividend quite rapidly, which is exciting. However, the short payment history makes us question whether this performance will persist across a full market cycle.
Dividend Growth Potential
While dividend payments have been relatively reliable, it would also be nice if earnings per share (EPS) were growing, as this is essential to maintaining the dividend's purchasing power over the long term. Midwich Group's EPS have fallen by approximately 33% per year during the past five years. A sharp decline in earnings per share is not great from from a dividend perspective, as even conservative payout ratios can come under pressure if earnings fall far enough.
Conclusion
When we look at a dividend stock, we need to form a judgement on whether the dividend will grow, if the company is able to maintain it in a wide range of economic circumstances, and if the dividend payout is sustainable. Midwich Group's is paying out more than half its income as dividends, but at least the dividend is covered by both reported earnings and cashflow. Earnings per share are down, and to our mind Midwich Group has not been paying a dividend long enough to demonstrate its resilience across economic cycles. In summary, Midwich Group has a number of shortcomings that we'd find it hard to get past. Things could change, but we think there are likely more attractive alternatives out there.
Without at least some growth in earnings per share over time, the dividend will eventually come under pressure either from costs or inflation. See if the 3 analysts are forecasting a turnaround in our free collection of analyst estimates here.
Looking for more high-yielding dividend ideas? Try our curated list of dividend stocks with a yield above 3%.
If you spot an error that warrants correction, please contact the editor at editorial-team@simplywallst.com. This article by Simply Wall St is general in nature. It does not constitute a recommendation to buy or sell any stock, and does not take account of your objectives, or your financial situation. Simply Wall St has no position in the stocks mentioned.
We aim to bring you long-term focused research analysis driven by fundamental data. Note that our analysis may not factor in the latest price-sensitive company announcements or qualitative material. Thank you for reading.
