How Does MNF Group's (ASX:MNF) P/E Compare To Its Industry, After Its Big Share Price Gain?

It's really great to see that even after a strong run, MNF Group (ASX:MNF) shares have been powering on, with a gain of 30% in the last thirty days. Unfortunately, the full year gain of 6.8% wasn't so sweet.
Assuming no other changes, a sharply higher share price makes a stock less attractive to potential buyers. In the long term, share prices tend to follow earnings per share, but in the short term prices bounce around in response to short term factors (which are not always obvious). The implication here is that deep value investors might steer clear when expectations of a company are too high. Perhaps the simplest way to get a read on investors' expectations of a business is to look at its Price to Earnings Ratio (PE Ratio). A high P/E ratio means that investors have a high expectation about future growth, while a low P/E ratio means they have low expectations about future growth.
Check out our latest analysis for MNF Group
How Does MNF Group's P/E Ratio Compare To Its Peers?
MNF Group has a P/E ratio of 32.29. The image below shows that MNF Group has a P/E ratio that is roughly in line with the telecom industry average (32.2).
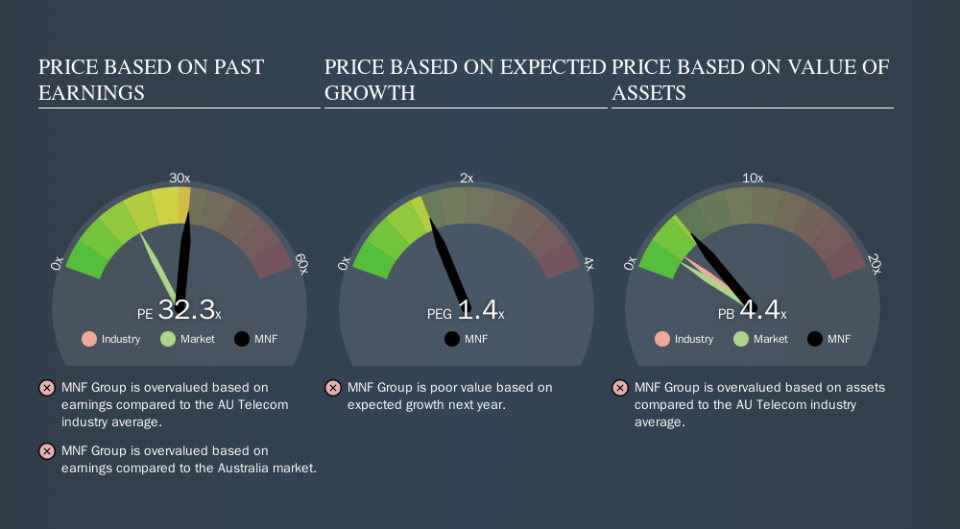
MNF Group's P/E tells us that market participants think its prospects are roughly in line with its industry. The company could surprise by performing better than average, in the future. Further research into factors such as insider buying and selling, could help you form your own view on whether that is likely.
How Growth Rates Impact P/E Ratios
P/E ratios primarily reflect market expectations around earnings growth rates. That's because companies that grow earnings per share quickly will rapidly increase the 'E' in the equation. Therefore, even if you pay a high multiple of earnings now, that multiple will become lower in the future. Then, a lower P/E should attract more buyers, pushing the share price up.
MNF Group's earnings per share fell by 4.3% in the last twelve months. But EPS is up 11% over the last 5 years.
A Limitation: P/E Ratios Ignore Debt and Cash In The Bank
It's important to note that the P/E ratio considers the market capitalization, not the enterprise value. In other words, it does not consider any debt or cash that the company may have on the balance sheet. Theoretically, a business can improve its earnings (and produce a lower P/E in the future) by investing in growth. That means taking on debt (or spending its cash).
Such expenditure might be good or bad, in the long term, but the point here is that the balance sheet is not reflected by this ratio.
Is Debt Impacting MNF Group's P/E?
MNF Group has net debt worth 11% of its market capitalization. It would probably deserve a higher P/E ratio if it was net cash, since it would have more options for growth.
The Bottom Line On MNF Group's P/E Ratio
MNF Group has a P/E of 32.3. That's higher than the average in its market, which is 18.2. With modest debt but no EPS growth in the last year, it's fair to say the P/E implies some optimism about future earnings, from the market. What is very clear is that the market has become significantly more optimistic about MNF Group over the last month, with the P/E ratio rising from 24.8 back then to 32.3 today. For those who prefer to invest with the flow of momentum, that might mean it's time to put the stock on a watchlist, or research it. But the contrarian may see it as a missed opportunity.
When the market is wrong about a stock, it gives savvy investors an opportunity. People often underestimate remarkable growth -- so investors can make money when fast growth is not fully appreciated. So this free visual report on analyst forecasts could hold the key to an excellent investment decision.
Of course, you might find a fantastic investment by looking at a few good candidates. So take a peek at this free list of companies with modest (or no) debt, trading on a P/E below 20.
We aim to bring you long-term focused research analysis driven by fundamental data. Note that our analysis may not factor in the latest price-sensitive company announcements or qualitative material.
If you spot an error that warrants correction, please contact the editor at editorial-team@simplywallst.com. This article by Simply Wall St is general in nature. It does not constitute a recommendation to buy or sell any stock, and does not take account of your objectives, or your financial situation. Simply Wall St has no position in the stocks mentioned. Thank you for reading.
