What Does MRC Global Inc.'s (NYSE:MRC) Balance Sheet Tell Us About It?

Want to participate in a short research study? Help shape the future of investing tools and you could win a $250 gift card!
MRC Global Inc. (NYSE:MRC) is a small-cap stock with a market capitalization of US$1.4b. While investors primarily focus on the growth potential and competitive landscape of the small-cap companies, they end up ignoring a key aspect, which could be the biggest threat to its existence: its financial health. Why is it important? Understanding the company's financial health becomes vital, as mismanagement of capital can lead to bankruptcies, which occur at a higher rate for small-caps. The following basic checks can help you get a picture of the company's balance sheet strength. However, potential investors would need to take a closer look, and I’d encourage you to dig deeper yourself into MRC here.
MRC’s Debt (And Cash Flows)
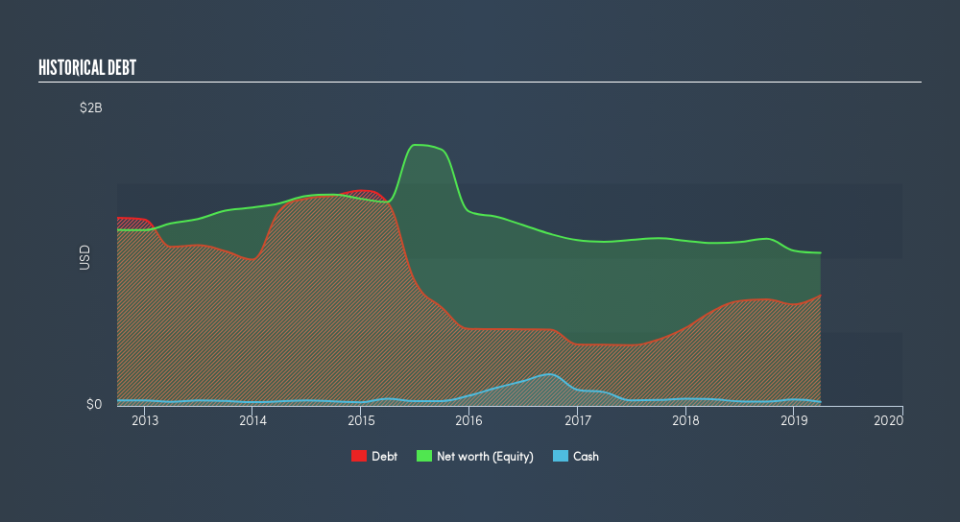
Over the past year, MRC has ramped up its debt from US$639m to US$951m – this includes long-term debt. With this rise in debt, MRC currently has US$27m remaining in cash and short-term investments to keep the business going. Moreover, MRC has produced US$23m in operating cash flow over the same time period, leading to an operating cash to total debt ratio of 2.4%, signalling that MRC’s operating cash is less than its debt.
Can MRC meet its short-term obligations with the cash in hand?
At the current liabilities level of US$598m, it appears that the company has maintained a safe level of current assets to meet its obligations, with the current ratio last standing at 2.54x. The current ratio is calculated by dividing current assets by current liabilities. For Trade Distributors companies, this ratio is within a sensible range since there is a bit of a cash buffer without leaving too much capital in a low-return environment.
Does MRC face the risk of succumbing to its debt-load?
MRC is a relatively highly levered company with a debt-to-equity of 72%. This is a bit unusual for a small-cap stock, since they generally have a harder time borrowing than large more established companies. We can check to see whether MRC is able to meet its debt obligations by looking at the net interest coverage ratio. A company generating earnings before interest and tax (EBIT) at least three times its net interest payments is considered financially sound. In MRC's, case, the ratio of 3.21x suggests that interest is appropriately covered, which means that lenders may be willing to lend out more funding as MRC’s high interest coverage is seen as responsible and safe practice.
Next Steps:
MRC’s high cash coverage means that, although its debt levels are high, the company is able to utilise its borrowings efficiently in order to generate cash flow. Since there is also no concerns around MRC's liquidity needs, this may be its optimal capital structure for the time being. Keep in mind I haven't considered other factors such as how MRC has been performing in the past. I recommend you continue to research MRC Global to get a better picture of the small-cap by looking at:
Future Outlook: What are well-informed industry analysts predicting for MRC’s future growth? Take a look at our free research report of analyst consensus for MRC’s outlook.
Valuation: What is MRC worth today? Is the stock undervalued, even when its growth outlook is factored into its intrinsic value? The intrinsic value infographic in our free research report helps visualize whether MRC is currently mispriced by the market.
Other High-Performing Stocks: Are there other stocks that provide better prospects with proven track records? Explore our free list of these great stocks here.
We aim to bring you long-term focused research analysis driven by fundamental data. Note that our analysis may not factor in the latest price-sensitive company announcements or qualitative material.
If you spot an error that warrants correction, please contact the editor at editorial-team@simplywallst.com. This article by Simply Wall St is general in nature. It does not constitute a recommendation to buy or sell any stock, and does not take account of your objectives, or your financial situation. Simply Wall St has no position in the stocks mentioned. Thank you for reading.
