What does Oil Search Limited’s (ASX:OSH) Balance Sheet Tell Us About Its Future?

Want to participate in a short research study? Help shape the future of investing tools and receive a $20 prize!
Small-caps and large-caps are wildly popular among investors, however, mid-cap stocks, such as Oil Search Limited (ASX:OSH), with a market capitalization of AU$12b, rarely draw their attention from the investing community. However, history shows that overlooked mid-cap companies have performed better on a risk-adjusted manner than the smaller and larger segment of the market. This article will examine OSH’s financial liquidity and debt levels to get an idea of whether the company can deal with cyclical downturns and maintain funds to accommodate strategic spending for future growth. Note that this commentary is very high-level and solely focused on financial health, so I suggest you dig deeper yourself into OSH here.
View our latest analysis for Oil Search
Does OSH produce enough cash relative to debt?
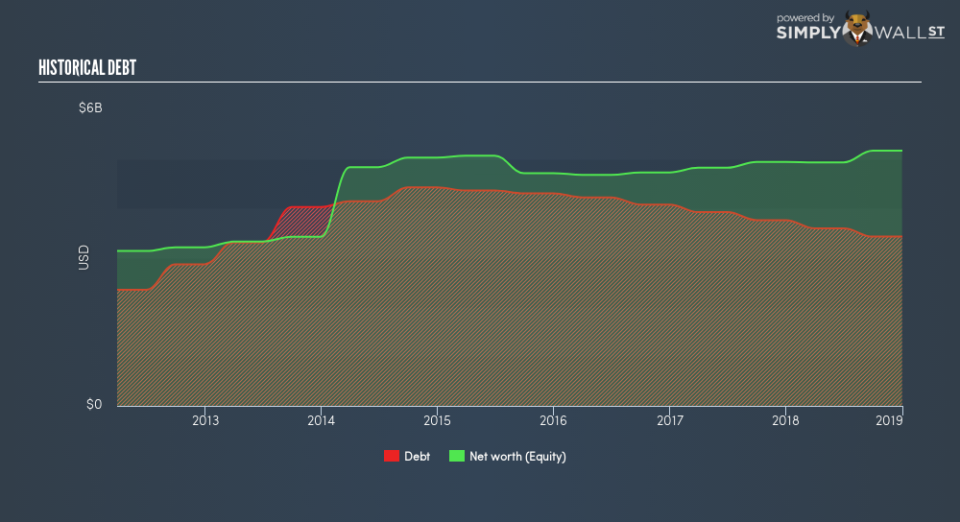
OSH has shrunken its total debt levels in the last twelve months, from US$3.8b to US$3.4b , which includes long-term debt. With this debt payback, OSH currently has US$601m remaining in cash and short-term investments , ready to deploy into the business. On top of this, OSH has produced US$855m in operating cash flow in the last twelve months, resulting in an operating cash to total debt ratio of 25%, meaning that OSH’s current level of operating cash is high enough to cover debt. This ratio can also be interpreted as a measure of efficiency as an alternative to return on assets. In OSH’s case, it is able to generate 0.25x cash from its debt capital.
Does OSH’s liquid assets cover its short-term commitments?
Looking at OSH’s US$771m in current liabilities, it seems that the business has maintained a safe level of current assets to meet its obligations, with the current ratio last standing at 1.21x. Generally, for Oil and Gas companies, this is a reasonable ratio since there’s a sufficient cash cushion without leaving too much capital idle or in low-earning investments.
Can OSH service its debt comfortably?
With a debt-to-equity ratio of 66%, OSH can be considered as an above-average leveraged company. This is not uncommon for a mid-cap company given that debt tends to be lower-cost and at times, more accessible. We can check to see whether OSH is able to meet its debt obligations by looking at the net interest coverage ratio. A company generating earnings before interest and tax (EBIT) at least three times its net interest payments is considered financially sound. In OSH’s, case, the ratio of 3.42x suggests that interest is appropriately covered, which means that debtors may be willing to loan the company more money, giving OSH ample headroom to grow its debt facilities.
Next Steps:
OSH’s high cash coverage means that, although its debt levels are high, the company is able to utilise its borrowings efficiently in order to generate cash flow. This may mean this is an optimal capital structure for the business, given that it is also meeting its short-term commitment. Keep in mind I haven’t considered other factors such as how OSH has been performing in the past. I recommend you continue to research Oil Search to get a better picture of the mid-cap by looking at:
Future Outlook: What are well-informed industry analysts predicting for OSH’s future growth? Take a look at our free research report of analyst consensus for OSH’s outlook.
Valuation: What is OSH worth today? Is the stock undervalued, even when its growth outlook is factored into its intrinsic value? The intrinsic value infographic in our free research report helps visualize whether OSH is currently mispriced by the market.
Other High-Performing Stocks: Are there other stocks that provide better prospects with proven track records? Explore our free list of these great stocks here.
We aim to bring you long-term focused research analysis driven by fundamental data. Note that our analysis may not factor in the latest price-sensitive company announcements or qualitative material.
If you spot an error that warrants correction, please contact the editor at editorial-team@simplywallst.com. This article by Simply Wall St is general in nature. It does not constitute a recommendation to buy or sell any stock, and does not take account of your objectives, or your financial situation. Simply Wall St has no position in the stocks mentioned. On rare occasion, data errors may occur. Thank you for reading.
