How Does OM Holdings's (ASX:OMH) P/E Compare To Its Industry, After The Share Price Drop?

Unfortunately for some shareholders, the OM Holdings (ASX:OMH) share price has dived 43% in the last thirty days. And that drop will have no doubt have some shareholders concerned that the 81% share price decline, over the last year, has turned them into bagholders. For those wondering, a bagholder is someone who keeps holding a losing stock indefinitely, without taking the time to consider its prospects carefully, going forward.
All else being equal, a share price drop should make a stock more attractive to potential investors. In the long term, share prices tend to follow earnings per share, but in the short term prices bounce around in response to short term factors (which are not always obvious). The implication here is that long term investors have an opportunity when expectations of a company are too low. Perhaps the simplest way to get a read on investors' expectations of a business is to look at its Price to Earnings Ratio (PE Ratio). Investors have optimistic expectations of companies with higher P/E ratios, compared to companies with lower P/E ratios.
See our latest analysis for OM Holdings
How Does OM Holdings's P/E Ratio Compare To Its Peers?
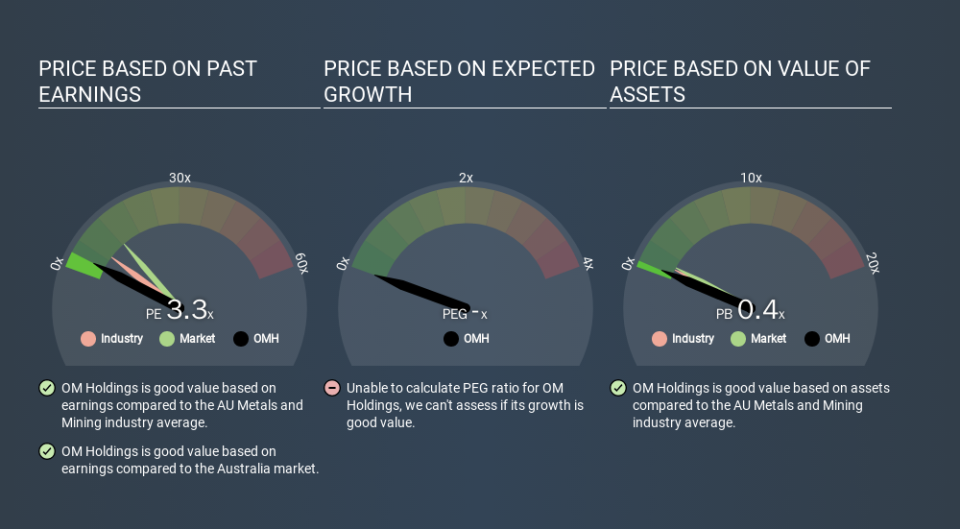
We can tell from its P/E ratio of 3.25 that sentiment around OM Holdings isn't particularly high. The image below shows that OM Holdings has a lower P/E than the average (7.2) P/E for companies in the metals and mining industry.
This suggests that market participants think OM Holdings will underperform other companies in its industry. Many investors like to buy stocks when the market is pessimistic about their prospects. It is arguably worth checking if insiders are buying shares, because that might imply they believe the stock is undervalued.
How Growth Rates Impact P/E Ratios
Earnings growth rates have a big influence on P/E ratios. If earnings are growing quickly, then the 'E' in the equation will increase faster than it would otherwise. That means unless the share price increases, the P/E will reduce in a few years. And as that P/E ratio drops, the company will look cheap, unless its share price increases.
OM Holdings's earnings per share fell by 65% in the last twelve months. But over the longer term (3 years), earnings per share have increased by 92%.
Don't Forget: The P/E Does Not Account For Debt or Bank Deposits
One drawback of using a P/E ratio is that it considers market capitalization, but not the balance sheet. That means it doesn't take debt or cash into account. Hypothetically, a company could reduce its future P/E ratio by spending its cash (or taking on debt) to achieve higher earnings.
While growth expenditure doesn't always pay off, the point is that it is a good option to have; but one that the P/E ratio ignores.
OM Holdings's Balance Sheet
OM Holdings's net debt is considerable, at 231% of its market cap. If you want to compare its P/E ratio to other companies, you must keep in mind that these debt levels would usually warrant a relatively low P/E.
The Verdict On OM Holdings's P/E Ratio
OM Holdings's P/E is 3.3 which is below average (12.5) in the AU market. Given meaningful debt, and a lack of recent growth, the market looks to be extrapolating this recent performance; reflecting low expectations for the future. What can be absolutely certain is that the market has become more pessimistic about OM Holdings over the last month, with the P/E ratio falling from 5.7 back then to 3.3 today. For those who prefer to invest with the flow of momentum, that might be a bad sign, but for deep value investors this stock might justify some research.
When the market is wrong about a stock, it gives savvy investors an opportunity. As value investor Benjamin Graham famously said, 'In the short run, the market is a voting machine but in the long run, it is a weighing machine. Although we don't have analyst forecasts shareholders might want to examine this detailed historical graph of earnings, revenue and cash flow.
Of course, you might find a fantastic investment by looking at a few good candidates. So take a peek at this free list of companies with modest (or no) debt, trading on a P/E below 20.
If you spot an error that warrants correction, please contact the editor at editorial-team@simplywallst.com. This article by Simply Wall St is general in nature. It does not constitute a recommendation to buy or sell any stock, and does not take account of your objectives, or your financial situation. Simply Wall St has no position in the stocks mentioned.
We aim to bring you long-term focused research analysis driven by fundamental data. Note that our analysis may not factor in the latest price-sensitive company announcements or qualitative material. Thank you for reading.
