Does Parmalat SpA’s (BIT:PLT) 31.72% Earnings Growth Make It An Outperformer?

Assessing Parmalat SpA’s (BIT:PLT) performance as a company requires looking at more than just a years’ earnings data. Below, I will run you through a simple sense check to build perspective on how Parmalat is doing by comparing its most recent earnings with its historical trend, in addition to the performance of its food industry peers. Check out our latest analysis for Parmalat
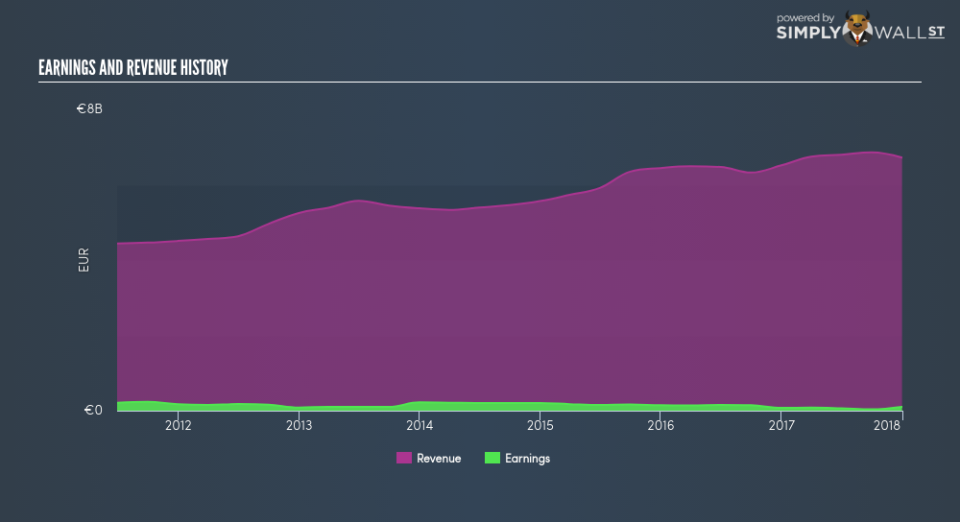
Did PLT beat its long-term earnings growth trend and its industry?
PLT’s trailing twelve-month earnings (from 31 December 2017) of €103.40m has jumped 31.72% compared to the previous year. Furthermore, this one-year growth rate has exceeded its 5-year annual growth average of -9.57%, indicating the rate at which PLT is growing has accelerated. What’s the driver of this growth? Well, let’s take a look at whether it is merely a result of an industry uplift, or if Parmalat has experienced some company-specific growth.
Over the last few years, Parmalat top-line expansion has outpaced earnings and the growth rate of expenses. Though this resulted in a margin contraction, it has lessened Parmalat’s earnings contraction. Eyeballing growth from a sector-level, the IT food industry has been growing, albeit, at a unexciting single-digit rate of 4.13% in the previous twelve months, and a substantial 11.43% over the past five years. This means any recent headwind the industry is enduring, the impact on Parmalat has been softer relative to its peers.
In terms of returns from investment, Parmalat has not invested its equity funds well, leading to a 3.22% return on equity (ROE), below the sensible minimum of 20%. Furthermore, its return on assets (ROA) of 2.18% is below the IT Food industry of 4.48%, indicating Parmalat’s are utilized less efficiently. And finally, its return on capital (ROC), which also accounts for Parmalat’s debt level, has declined over the past 3 years from 8.77% to 5.48%. This correlates with an increase in debt holding, with debt-to-equity ratio rising from 1.18% to 14.23% over the past 5 years.
What does this mean?
Parmalat’s track record can be a valuable insight into its earnings performance, but it certainly doesn’t tell the whole story. Recent positive growth doesn’t necessarily mean it’s onwards and upwards for the company. I suggest you continue to research Parmalat to get a better picture of the stock by looking at:
Future Outlook: What are well-informed industry analysts predicting for PLT’s future growth? Take a look at our free research report of analyst consensus for PLT’s outlook.
Financial Health: Is PLT’s operations financially sustainable? Balance sheets can be hard to analyze, which is why we’ve done it for you. Check out our financial health checks here.
Other High-Performing Stocks: Are there other stocks that provide better prospects with proven track records? Explore our free list of these great stocks here.
NB: Figures in this article are calculated using data from the trailing twelve months from 31 December 2017. This may not be consistent with full year annual report figures.
To help readers see pass the short term volatility of the financial market, we aim to bring you a long-term focused research analysis purely driven by fundamental data. Note that our analysis does not factor in the latest price sensitive company announcements.
The author is an independent contributor and at the time of publication had no position in the stocks mentioned.
