How Does Rawson Oil and Gas Limited’s (ASX:RAW) EPS Growth Stack Up Against Industry Performance?

After looking at Rawson Oil and Gas Limited’s (ASX:RAW) latest earnings announcement (30 June 2017), I found it useful to revisit the company’s performance in the past couple of years and assess this against the most recent figures. As a long term investor, I pay close attention to earnings trend, rather than the figures published at one point in time. I also compare against an industry benchmark to check whether Rawson Oil and Gas’s performance has been impacted by industry movements. In this article I briefly touch on my key findings. Check out our latest analysis for Rawson Oil and Gas
How Did RAW’s Recent Performance Stack Up Against Its Past?
I use the ‘latest twelve-month’ data, which either annualizes the most recent 6-month earnings update, or in some cases, the most recent annual report is already the latest available financial data. This blend enables me to analyze many different companies on a similar basis, using new information. For Rawson Oil and Gas, the latest twelve-month earnings -A$0.4M, which compared to the previous year’s figure, has become less negative. Since these figures are somewhat myopic, I’ve calculated an annualized five-year figure for Rawson Oil and Gas’s earnings, which stands at -A$0.2M. This means Rawson Oil and Gas has historically performed better than recently, while it seems like earnings are now heading back towards a more favorable position once more.
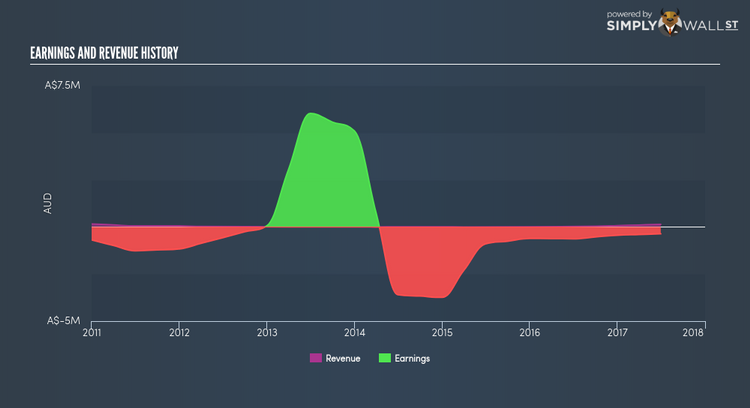
We can further evaluate Rawson Oil and Gas’s loss by looking at what’s going on in the industry on top of within the company. Initially, I want to quickly look into the line items. Revenue growth over last few years has been negative at -4.08%. The key to profitability here is to make sure the company’s cost growth is well-controlled. Looking at growth from a sector-level, the Australian oil, gas and consumable fuels industry has been multiplying average earnings growth of 57.50% in the past twelve months, and a more subdued 5.14% over the past five years. This means any tailwind the industry is benefiting from, Rawson Oil and Gas has not been able to realize the gains unlike its industry peers.
What does this mean?
Though Rawson Oil and Gas’s past data is helpful, it is only one aspect of my investment thesis. Companies that incur net loss is always hard to forecast what will happen in the future and when. The most useful step is to assess company-specific issues Rawson Oil and Gas may be facing and whether management guidance has consistently been met in the past. I suggest you continue to research Rawson Oil and Gas to get a better picture of the stock by looking at:
1. Financial Health: Is RAW’s operations financially sustainable? Balance sheets can be hard to analyze, which is why we’ve done it for you. Check out our financial health checks here.
2. Other High-Performing Stocks: Are there other stocks that provide better prospects with proven track records? Explore our free list of these great stocks here.
NB: Figures in this article are calculated using data from the last twelve months, which refer to the 12-month period ending on the last date of the month the financial statement is dated. This may not be consistent with full year annual report figures.
To help readers see pass the short term volatility of the financial market, we aim to bring you a long-term focused research analysis purely driven by fundamental data. Note that our analysis does not factor in the latest price sensitive company announcements.
The author is an independent contributor and at the time of publication had no position in the stocks mentioned.
