Does Samuel Heath & Sons PLC (LON:HSM) Have A Good P/E Ratio?

The goal of this article is to teach you how to use price to earnings ratios (P/E ratios). We'll show how you can use Samuel Heath & Sons PLC's (LON:HSM) P/E ratio to inform your assessment of the investment opportunity. What is Samuel Heath & Sons's P/E ratio? Well, based on the last twelve months it is 9.10. That corresponds to an earnings yield of approximately 11.0%.
View our latest analysis for Samuel Heath & Sons
How Do I Calculate A Price To Earnings Ratio?
The formula for P/E is:
Price to Earnings Ratio = Share Price ÷ Earnings per Share (EPS)
Or for Samuel Heath & Sons:
P/E of 9.10 = £2.65 ÷ £0.29 (Based on the year to March 2019.)
Is A High Price-to-Earnings Ratio Good?
The higher the P/E ratio, the higher the price tag of a business, relative to its trailing earnings. That isn't necessarily good or bad, but a high P/E implies relatively high expectations of what a company can achieve in the future.
How Does Samuel Heath & Sons's P/E Ratio Compare To Its Peers?
The P/E ratio indicates whether the market has higher or lower expectations of a company. The image below shows that Samuel Heath & Sons has a lower P/E than the average (13.3) P/E for companies in the building industry.
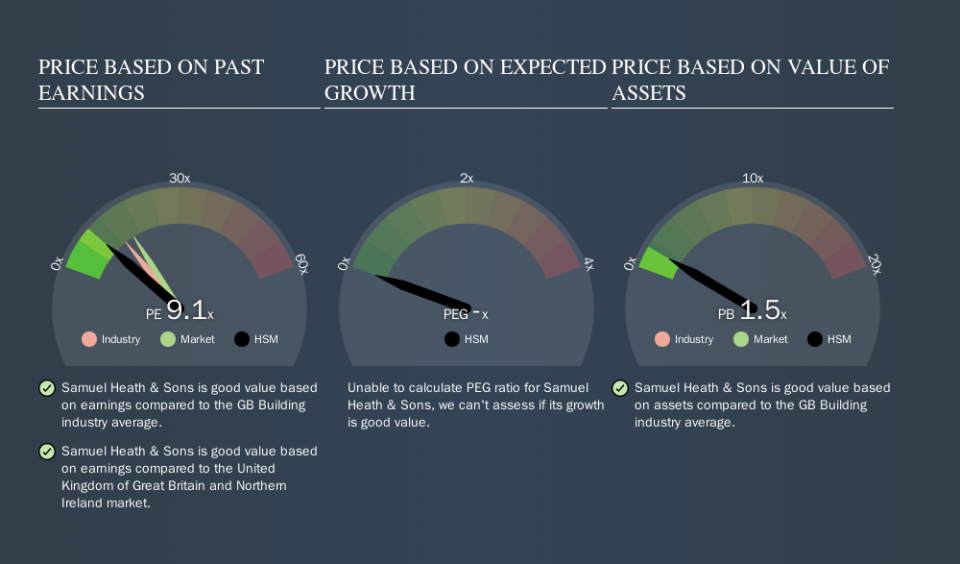
Samuel Heath & Sons's P/E tells us that market participants think it will not fare as well as its peers in the same industry. Since the market seems unimpressed with Samuel Heath & Sons, it's quite possible it could surprise on the upside. It is arguably worth checking if insiders are buying shares, because that might imply they believe the stock is undervalued.
How Growth Rates Impact P/E Ratios
When earnings fall, the 'E' decreases, over time. Therefore, even if you pay a low multiple of earnings now, that multiple will become higher in the future. A higher P/E should indicate the stock is expensive relative to others -- and that may encourage shareholders to sell.
Samuel Heath & Sons shrunk earnings per share by 25% over the last year. But over the longer term (5 years) earnings per share have increased by 11%. And it has shrunk its earnings per share by 1.4% per year over the last three years. This might lead to low expectations.
A Limitation: P/E Ratios Ignore Debt and Cash In The Bank
One drawback of using a P/E ratio is that it considers market capitalization, but not the balance sheet. Thus, the metric does not reflect cash or debt held by the company. In theory, a company can lower its future P/E ratio by using cash or debt to invest in growth.
While growth expenditure doesn't always pay off, the point is that it is a good option to have; but one that the P/E ratio ignores.
Samuel Heath & Sons's Balance Sheet
With net cash of UK£3.2m, Samuel Heath & Sons has a very strong balance sheet, which may be important for its business. Having said that, at 47% of its market capitalization the cash hoard would contribute towards a higher P/E ratio.
The Verdict On Samuel Heath & Sons's P/E Ratio
Samuel Heath & Sons has a P/E of 9.1. That's below the average in the GB market, which is 16.0. Falling earnings per share are likely to be keeping potential buyers away, the healthy balance sheet means the company retains potential for future growth. If that occurs, the current low P/E could prove to be temporary.
When the market is wrong about a stock, it gives savvy investors an opportunity. As value investor Benjamin Graham famously said, 'In the short run, the market is a voting machine but in the long run, it is a weighing machine. Although we don't have analyst forecasts shareholders might want to examine this detailed historical graph of earnings, revenue and cash flow.
But note: Samuel Heath & Sons may not be the best stock to buy. So take a peek at this free list of interesting companies with strong recent earnings growth (and a P/E ratio below 20).
We aim to bring you long-term focused research analysis driven by fundamental data. Note that our analysis may not factor in the latest price-sensitive company announcements or qualitative material.
If you spot an error that warrants correction, please contact the editor at editorial-team@simplywallst.com. This article by Simply Wall St is general in nature. It does not constitute a recommendation to buy or sell any stock, and does not take account of your objectives, or your financial situation. Simply Wall St has no position in the stocks mentioned. Thank you for reading.
