Does Scapa Group plc’s (LON:SCPA) Past Performance Indicate A Weaker Future?

Want to participate in a short research study? Help shape the future of investing tools and you could win a $250 gift card!
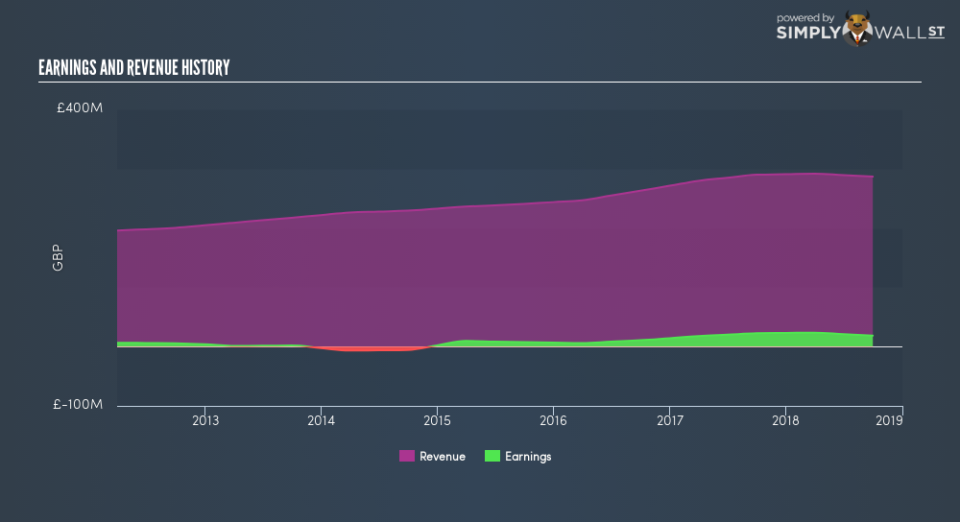
When Scapa Group plc (LON:SCPA) released its most recent earnings update (30 September 2018), I wanted to understand how these figures stacked up against its past performance. The two benchmarks I used were Scapa Group’s average earnings over the past couple of years, and its industry performance. These are useful yardsticks to help me gauge whether or not SCPA actually performed well. Below is a quick commentary on how I see SCPA has performed.
See our latest analysis for Scapa Group
Was SCPA’s weak performance lately a part of a long-term decline?
SCPA’s trailing twelve-month earnings (from 30 September 2018) of UK£19m has declined by -17% compared to the previous year.
Furthermore, this one-year growth rate has been lower than its average earnings growth rate over the past 5 years of 51%, indicating the rate at which SCPA is growing has slowed down. Why could this be happening? Well, let’s take a look at what’s occurring with margins and if the whole industry is facing the same headwind.
In terms of returns from investment, Scapa Group has fallen short of achieving a 20% return on equity (ROE), recording 13% instead. However, its return on assets (ROA) of 8.2% exceeds the GB Chemicals industry of 7.5%, indicating Scapa Group has used its assets more efficiently. And finally, its return on capital (ROC), which also accounts for Scapa Group’s debt level, has increased over the past 3 years from 13% to 17%. This correlates with a decrease in debt holding, with debt-to-equity ratio declining from 14% to 13% over the past 5 years.
What does this mean?
Though Scapa Group’s past data is helpful, it is only one aspect of my investment thesis. Companies that are profitable, but have capricious earnings, can have many factors affecting its business. You should continue to research Scapa Group to get a more holistic view of the stock by looking at:
Future Outlook: What are well-informed industry analysts predicting for SCPA’s future growth? Take a look at our free research report of analyst consensus for SCPA’s outlook.
Financial Health: Are SCPA’s operations financially sustainable? Balance sheets can be hard to analyze, which is why we’ve done it for you. Check out our financial health checks here.
Other High-Performing Stocks: Are there other stocks that provide better prospects with proven track records? Explore our free list of these great stocks here.
NB: Figures in this article are calculated using data from the trailing twelve months from 30 September 2018. This may not be consistent with full year annual report figures.
To help readers see past the short term volatility of the financial market, we aim to bring you a long-term focused research analysis purely driven by fundamental data. Note that our analysis does not factor in the latest price-sensitive company announcements.
The author is an independent contributor and at the time of publication had no position in the stocks mentioned. For errors that warrant correction please contact the editor at editorial-team@simplywallst.com.
