What Does Scholastic Corporation's (NASDAQ:SCHL) P/E Ratio Tell You?

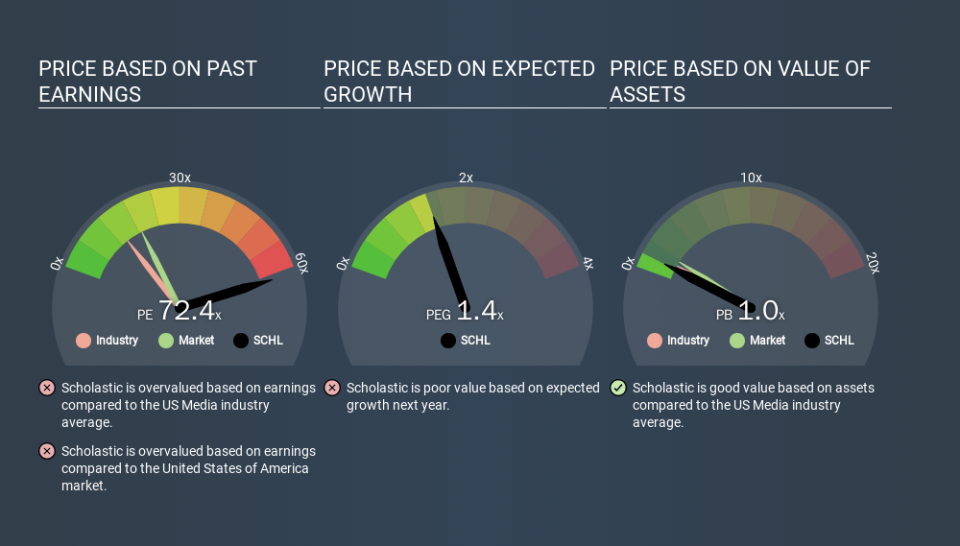
Today, we'll introduce the concept of the P/E ratio for those who are learning about investing. We'll show how you can use Scholastic Corporation's (NASDAQ:SCHL) P/E ratio to inform your assessment of the investment opportunity. What is Scholastic's P/E ratio? Well, based on the last twelve months it is 72.43. That corresponds to an earnings yield of approximately 1.4%.
View our latest analysis for Scholastic
How Do I Calculate A Price To Earnings Ratio?
The formula for price to earnings is:
Price to Earnings Ratio = Share Price ÷ Earnings per Share (EPS)
Or for Scholastic:
P/E of 72.43 = USD36.63 ÷ USD0.51 (Based on the year to November 2019.)
Is A High Price-to-Earnings Ratio Good?
A higher P/E ratio means that buyers have to pay a higher price for each USD1 the company has earned over the last year. That isn't a good or a bad thing on its own, but a high P/E means that buyers have a higher opinion of the business's prospects, relative to stocks with a lower P/E.
Does Scholastic Have A Relatively High Or Low P/E For Its Industry?
We can get an indication of market expectations by looking at the P/E ratio. As you can see below, Scholastic has a much higher P/E than the average company (14.2) in the media industry.
That means that the market expects Scholastic will outperform other companies in its industry. The market is optimistic about the future, but that doesn't guarantee future growth. So further research is always essential. I often monitor director buying and selling.
How Growth Rates Impact P/E Ratios
Companies that shrink earnings per share quickly will rapidly decrease the 'E' in the equation. That means even if the current P/E is low, it will increase over time if the share price stays flat. A higher P/E should indicate the stock is expensive relative to others -- and that may encourage shareholders to sell.
Notably, Scholastic grew EPS by a whopping 49% in the last year. But earnings per share are down 32% per year over the last three years.
Don't Forget: The P/E Does Not Account For Debt or Bank Deposits
The 'Price' in P/E reflects the market capitalization of the company. In other words, it does not consider any debt or cash that the company may have on the balance sheet. Hypothetically, a company could reduce its future P/E ratio by spending its cash (or taking on debt) to achieve higher earnings.
Such spending might be good or bad, overall, but the key point here is that you need to look at debt to understand the P/E ratio in context.
Is Debt Impacting Scholastic's P/E?
With net cash of US$262m, Scholastic has a very strong balance sheet, which may be important for its business. Having said that, at 21% of its market capitalization the cash hoard would contribute towards a higher P/E ratio.
The Bottom Line On Scholastic's P/E Ratio
Scholastic's P/E is 72.4 which suggests the market is more focussed on the future opportunity rather than the current level of earnings. Its net cash position is the cherry on top of its superb EPS growth. To us, this is the sort of company that we would expect to carry an above average price tag (relative to earnings).
When the market is wrong about a stock, it gives savvy investors an opportunity. As value investor Benjamin Graham famously said, 'In the short run, the market is a voting machine but in the long run, it is a weighing machine. So this free visual report on analyst forecasts could hold the key to an excellent investment decision.
Of course you might be able to find a better stock than Scholastic. So you may wish to see this free collection of other companies that have grown earnings strongly.
If you spot an error that warrants correction, please contact the editor at editorial-team@simplywallst.com. This article by Simply Wall St is general in nature. It does not constitute a recommendation to buy or sell any stock, and does not take account of your objectives, or your financial situation. Simply Wall St has no position in the stocks mentioned.
We aim to bring you long-term focused research analysis driven by fundamental data. Note that our analysis may not factor in the latest price-sensitive company announcements or qualitative material. Thank you for reading.
