How Does ScS Group plc’s (LSE:SCS) EPS Growth Stack Up Against Industry Performance?

Today I will examine ScS Group plc’s (LSE:SCS) latest earnings update (29 July 2017) and compare these figures against its performance over the past couple of years, in addition to how the rest of SCS’s industry performed. As a long-term investor, I find it useful to analyze the company’s trend over time in order to estimate whether or not the company is able to meet its goals, and eventually grow sustainably over time. View our latest analysis for ScS Group
Could SCS beat the long-term trend and outperform its industry?
To account for any quarterly or half-yearly updates, I use data from the most recent 12 months, which either annualizes the most recent 6-month earnings update, or in some cases, the most recent annual report is already the latest available financial data. This method allows me to examine different companies in a uniform manner using the latest information. For ScS Group, the most recent bottom-line is £9M, which, against the previous year’s figure, has increased by a fairly unexciting 7.85%. Since these figures are fairly short-term thinking, I’ve estimated an annualized five-year value for SCS’s net income, which stands at £4M. This means on average, ScS Group has been able to gradually improve its bottom line over the last couple of years as well.
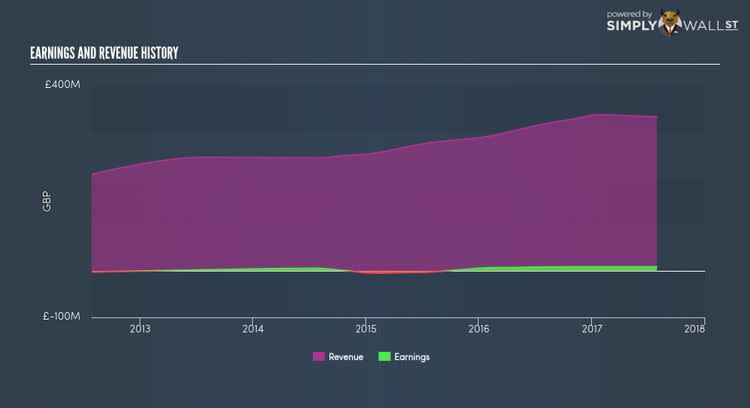
How has it been able to do this? Let’s see if it is only due to an industry uplift, or if ScS Group has seen some company-specific growth. In the last couple of years, ScS Group increased its bottom line faster than revenue by successfully controlling its costs. This has led to a margin expansion and profitability over time. Scanning growth from a sector-level, the UK specialty retail industry has been growing, albeit, at a muted single-digit rate of 5.58% over the previous twelve months, and 6.87% over the past five years. This means any tailwind the industry is benefiting from, ScS Group is capable of leveraging this to its advantage.
What does this mean?
ScS Group’s track record can be a valuable insight into its earnings performance, but it certainly doesn’t tell the whole story. While ScS Group has a good historical track record with positive growth and profitability, there’s no certainty that this will extrapolate into the future. You should continue to research ScS Group to get a better picture of the stock by looking at:
1. Future Outlook: What are well-informed industry analysts predicting for SCS’s future growth? Take a look at our free research report of analyst consensus for SCS’s outlook.
2. Financial Health: Is SCS’s operations financially sustainable? Balance sheets can be hard to analyze, which is why we’ve done it for you. Check out our financial health checks here.
3. Other High-Performing Stocks: Are there other stocks that provide better prospects with proven track records? Explore our free list of these great stocks here.
NB: Figures in this article are calculated using data from the last twelve months, which refer to the 12-month period ending on the last date of the month the financial statement is dated. This may not be consistent with full year annual report figures.
To help readers see pass the short term volatility of the financial market, we aim to bring you a long-term focused research analysis purely driven by fundamental data. Note that our analysis does not factor in the latest price sensitive company announcements.
The author is an independent contributor and at the time of publication had no position in the stocks mentioned.
