Does Shenzhen International Holdings Limited's (HKG:152) P/E Ratio Signal A Buying Opportunity?

This article is written for those who want to get better at using price to earnings ratios (P/E ratios). We'll show how you can use Shenzhen International Holdings Limited's (HKG:152) P/E ratio to inform your assessment of the investment opportunity. What is Shenzhen International Holdings's P/E ratio? Well, based on the last twelve months it is 8.74. That corresponds to an earnings yield of approximately 11%.
View our latest analysis for Shenzhen International Holdings
How Do You Calculate Shenzhen International Holdings's P/E Ratio?
The formula for price to earnings is:
Price to Earnings Ratio = Price per Share ÷ Earnings per Share (EPS)
Or for Shenzhen International Holdings:
P/E of 8.74 = HK$17.74 ÷ HK$2.03 (Based on the year to December 2018.)
Is A High P/E Ratio Good?
A higher P/E ratio means that buyers have to pay a higher price for each HK$1 the company has earned over the last year. All else being equal, it's better to pay a low price -- but as Warren Buffett said, 'It's far better to buy a wonderful company at a fair price than a fair company at a wonderful price.'
How Growth Rates Impact P/E Ratios
P/E ratios primarily reflect market expectations around earnings growth rates. When earnings grow, the 'E' increases, over time. That means even if the current P/E is high, it will reduce over time if the share price stays flat. A lower P/E should indicate the stock is cheap relative to others -- and that may attract buyers.
Shenzhen International Holdings increased earnings per share by 6.0% last year. And it has bolstered its earnings per share by 15% per year over the last five years.
How Does Shenzhen International Holdings's P/E Ratio Compare To Its Peers?
The P/E ratio indicates whether the market has higher or lower expectations of a company. If you look at the image below, you can see Shenzhen International Holdings has a lower P/E than the average (9.6) in the infrastructure industry classification.
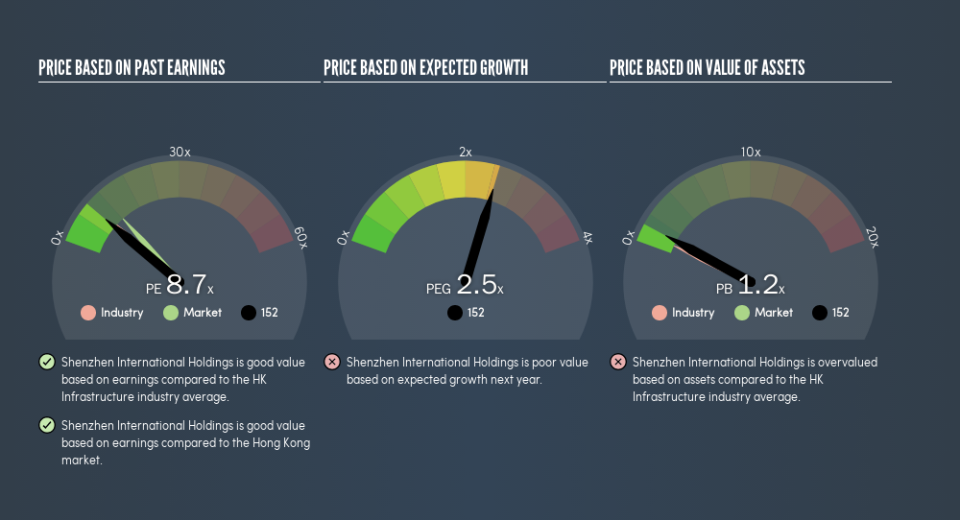
This suggests that market participants think Shenzhen International Holdings will underperform other companies in its industry. Many investors like to buy stocks when the market is pessimistic about their prospects. You should delve deeper. I like to check if company insiders have been buying or selling.
A Limitation: P/E Ratios Ignore Debt and Cash In The Bank
The 'Price' in P/E reflects the market capitalization of the company. So it won't reflect the advantage of cash, or disadvantage of debt. Hypothetically, a company could reduce its future P/E ratio by spending its cash (or taking on debt) to achieve higher earnings.
While growth expenditure doesn't always pay off, the point is that it is a good option to have; but one that the P/E ratio ignores.
Is Debt Impacting Shenzhen International Holdings's P/E?
Net debt is 31% of Shenzhen International Holdings's market cap. You'd want to be aware of this fact, but it doesn't bother us.
The Bottom Line On Shenzhen International Holdings's P/E Ratio
Shenzhen International Holdings has a P/E of 8.7. That's below the average in the HK market, which is 12.1. EPS grew over the last twelve months, and debt levels are quite reasonable. If you believe growth will continue - or even increase - then the low P/E may signify opportunity.
Investors have an opportunity when market expectations about a stock are wrong. If the reality for a company is not as bad as the P/E ratio indicates, then the share price should increase as the market realizes this. So this free visualization of the analyst consensus on future earnings could help you make the right decision about whether to buy, sell, or hold.
You might be able to find a better buy than Shenzhen International Holdings. If you want a selection of possible winners, check out this free list of interesting companies that trade on a P/E below 20 (but have proven they can grow earnings).
We aim to bring you long-term focused research analysis driven by fundamental data. Note that our analysis may not factor in the latest price-sensitive company announcements or qualitative material.
If you spot an error that warrants correction, please contact the editor at editorial-team@simplywallst.com. This article by Simply Wall St is general in nature. It does not constitute a recommendation to buy or sell any stock, and does not take account of your objectives, or your financial situation. Simply Wall St has no position in the stocks mentioned. Thank you for reading.
