How Does Simply Good Foods's (NASDAQ:SMPL) P/E Compare To Its Industry, After The Share Price Drop?

To the annoyance of some shareholders, Simply Good Foods (NASDAQ:SMPL) shares are down a considerable 30% in the last month. Even longer term holders have taken a real hit with the stock declining 20% in the last year.
Assuming nothing else has changed, a lower share price makes a stock more attractive to potential buyers. In the long term, share prices tend to follow earnings per share, but in the short term prices bounce around in response to short term factors (which are not always obvious). So, on certain occasions, long term focussed investors try to take advantage of pessimistic expectations to buy shares at a better price. Perhaps the simplest way to get a read on investors' expectations of a business is to look at its Price to Earnings Ratio (PE Ratio). A high P/E implies that investors have high expectations of what a company can achieve compared to a company with a low P/E ratio.
Check out our latest analysis for Simply Good Foods
How Does Simply Good Foods's P/E Ratio Compare To Its Peers?
We can tell from its P/E ratio of 49.14 that there is some investor optimism about Simply Good Foods. As you can see below, Simply Good Foods has a higher P/E than the average company (21.2) in the food industry.
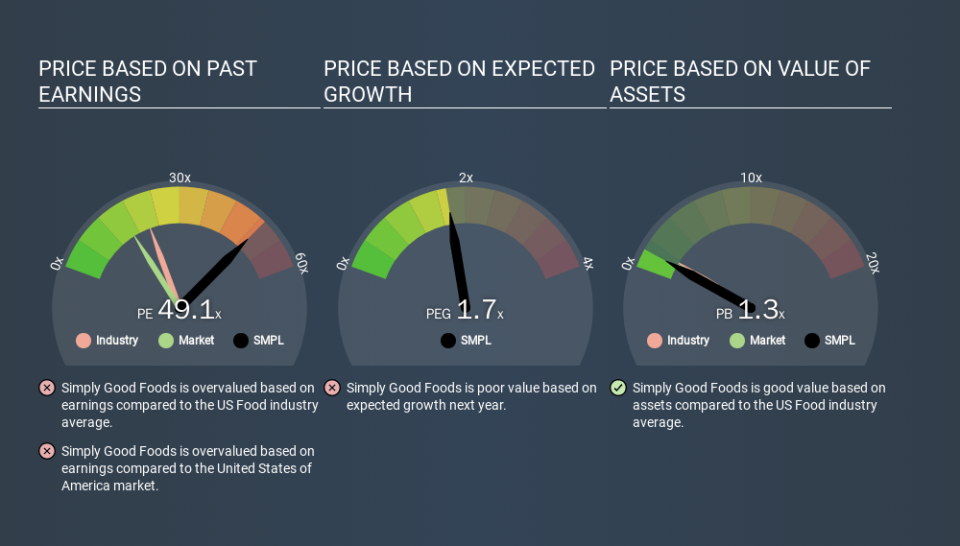
Simply Good Foods's P/E tells us that market participants think the company will perform better than its industry peers, going forward. The market is optimistic about the future, but that doesn't guarantee future growth. So investors should delve deeper. I like to check if company insiders have been buying or selling.
How Growth Rates Impact P/E Ratios
P/E ratios primarily reflect market expectations around earnings growth rates. When earnings grow, the 'E' increases, over time. That means even if the current P/E is high, it will reduce over time if the share price stays flat. Then, a lower P/E should attract more buyers, pushing the share price up.
Simply Good Foods saw earnings per share decrease by 68% last year.
Remember: P/E Ratios Don't Consider The Balance Sheet
The 'Price' in P/E reflects the market capitalization of the company. In other words, it does not consider any debt or cash that the company may have on the balance sheet. In theory, a company can lower its future P/E ratio by using cash or debt to invest in growth.
While growth expenditure doesn't always pay off, the point is that it is a good option to have; but one that the P/E ratio ignores.
So What Does Simply Good Foods's Balance Sheet Tell Us?
Simply Good Foods has net debt equal to 37% of its market cap. While that's enough to warrant consideration, it doesn't really concern us.
The Bottom Line On Simply Good Foods's P/E Ratio
Simply Good Foods trades on a P/E ratio of 49.1, which is multiples above its market average of 15.1. With some debt but no EPS growth last year, the market has high expectations of future profits. What can be absolutely certain is that the market has become significantly less optimistic about Simply Good Foods over the last month, with the P/E ratio falling from 70.6 back then to 49.1 today. For those who prefer to invest with the flow of momentum, that might be a bad sign, but for a contrarian, it may signal opportunity.
Investors have an opportunity when market expectations about a stock are wrong. As value investor Benjamin Graham famously said, 'In the short run, the market is a voting machine but in the long run, it is a weighing machine. So this free visualization of the analyst consensus on future earnings could help you make the right decision about whether to buy, sell, or hold.
Of course you might be able to find a better stock than Simply Good Foods. So you may wish to see this free collection of other companies that have grown earnings strongly.
If you spot an error that warrants correction, please contact the editor at editorial-team@simplywallst.com. This article by Simply Wall St is general in nature. It does not constitute a recommendation to buy or sell any stock, and does not take account of your objectives, or your financial situation. Simply Wall St has no position in the stocks mentioned.
We aim to bring you long-term focused research analysis driven by fundamental data. Note that our analysis may not factor in the latest price-sensitive company announcements or qualitative material. Thank you for reading.
