What Does SRE Group Limited’s (HKG:1207) P/E Ratio Tell You?

Want to participate in a short research study? Help shape the future of investing tools and receive a $20 prize!
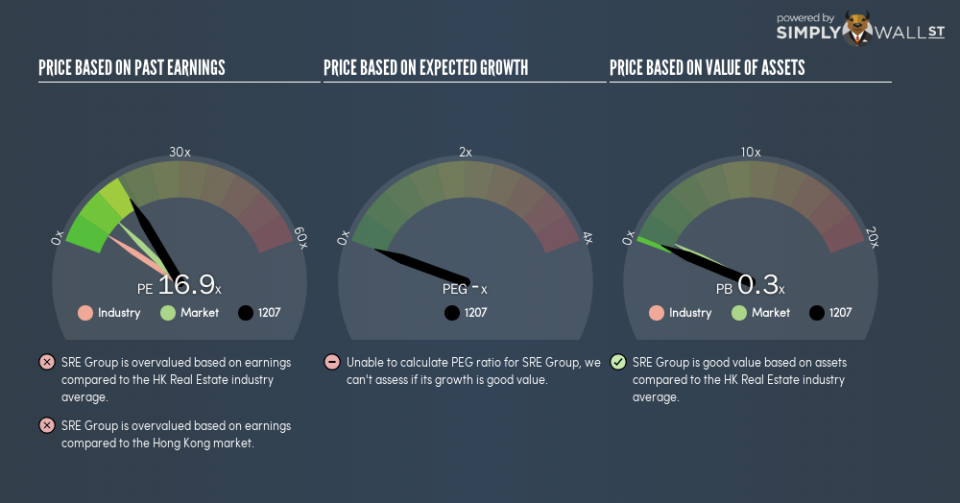
This article is for investors who would like to improve their understanding of price to earnings ratios (P/E ratios). To keep it practical, we’ll show how SRE Group Limited’s (HKG:1207) P/E ratio could help you assess the value on offer. Based on the last twelve months, SRE Group’s P/E ratio is 16.89. In other words, at today’s prices, investors are paying HK$16.89 for every HK$1 in prior year profit.
Check out our latest analysis for SRE Group
How Do You Calculate A P/E Ratio?
The formula for P/E is:
Price to Earnings Ratio = Share Price (in reporting currency) ÷ Earnings per Share (EPS)
Or for SRE Group:
P/E of 16.89 = CN¥0.12 (Note: this is the share price in the reporting currency, namely, CNY ) ÷ CN¥0.0073 (Based on the trailing twelve months to June 2018.)
Is A High Price-to-Earnings Ratio Good?
A higher P/E ratio means that investors are paying a higher price for each HK$1 of company earnings. That isn’t necessarily good or bad, but a high P/E implies relatively high expectations of what a company can achieve in the future.
How Growth Rates Impact P/E Ratios
Earnings growth rates have a big influence on P/E ratios. That’s because companies that grow earnings per share quickly will rapidly increase the ‘E’ in the equation. Therefore, even if you pay a high multiple of earnings now, that multiple will become lower in the future. Then, a lower P/E should attract more buyers, pushing the share price up.
SRE Group shrunk earnings per share by 44% over the last year. But EPS is up 103% over the last 3 years. And it has shrunk its earnings per share by 4.7% per year over the last five years. This could justify a pessimistic P/E.
How Does SRE Group’s P/E Ratio Compare To Its Peers?
The P/E ratio indicates whether the market has higher or lower expectations of a company. As you can see below, SRE Group has a higher P/E than the average company (5.6) in the real estate industry.
That means that the market expects SRE Group will outperform other companies in its industry. Clearly the market expects growth, but it isn’t guaranteed. So further research is always essential. I often monitor director buying and selling.
Don’t Forget: The P/E Does Not Account For Debt or Bank Deposits
The ‘Price’ in P/E reflects the market capitalization of the company. Thus, the metric does not reflect cash or debt held by the company. Theoretically, a business can improve its earnings (and produce a lower P/E in the future), by taking on debt (or spending its remaining cash).
Spending on growth might be good or bad a few years later, but the point is that the P/E ratio does not account for the option (or lack thereof).
How Does SRE Group’s Debt Impact Its P/E Ratio?
SRE Group’s net debt is considerable, at 262% of its market cap. This level of debt justifies a relatively low P/E, so remain cognizant of the debt, if you’re comparing it to other stocks.
The Verdict On SRE Group’s P/E Ratio
SRE Group has a P/E of 16.9. That’s higher than the average in the HK market, which is 10.5. With meaningful debt and a lack of recent earnings growth, the market has high expectations that the business will earn more in the future.
Investors have an opportunity when market expectations about a stock are wrong. If the reality for a company is better than it expects, you can make money by buying and holding for the long term. Although we don’t have analyst forecasts, you might want to assess this data-rich visualization of earnings, revenue and cash flow.
You might be able to find a better buy than SRE Group. If you want a selection of possible winners, check out this free list of interesting companies that trade on a P/E below 20 (but have proven they can grow earnings).
We aim to bring you long-term focused research analysis driven by fundamental data. Note that our analysis may not factor in the latest price-sensitive company announcements or qualitative material.
If you spot an error that warrants correction, please contact the editor at editorial-team@simplywallst.com. This article by Simply Wall St is general in nature. It does not constitute a recommendation to buy or sell any stock, and does not take account of your objectives, or your financial situation. Simply Wall St has no position in the stocks mentioned. On rare occasion, data errors may occur. Thank you for reading.
