Does Standex International Corporation’s (NYSE:SXI) ROCE Reflect Well On The Business?

Today we'll evaluate Standex International Corporation (NYSE:SXI) to determine whether it could have potential as an investment idea. To be precise, we'll consider its Return On Capital Employed (ROCE), as that will inform our view of the quality of the business.
Firstly, we'll go over how we calculate ROCE. Then we'll compare its ROCE to similar companies. Last but not least, we'll look at what impact its current liabilities have on its ROCE.
Return On Capital Employed (ROCE): What is it?
ROCE is a metric for evaluating how much pre-tax income (in percentage terms) a company earns on the capital invested in its business. In general, businesses with a higher ROCE are usually better quality. Overall, it is a valuable metric that has its flaws. Author Edwin Whiting says to be careful when comparing the ROCE of different businesses, since 'No two businesses are exactly alike.
How Do You Calculate Return On Capital Employed?
Analysts use this formula to calculate return on capital employed:
Return on Capital Employed = Earnings Before Interest and Tax (EBIT) ÷ (Total Assets - Current Liabilities)
Or for Standex International:
0.11 = US$83m ÷ (US$922m - US$142m) (Based on the trailing twelve months to June 2019.)
Therefore, Standex International has an ROCE of 11%.
View our latest analysis for Standex International
Is Standex International's ROCE Good?
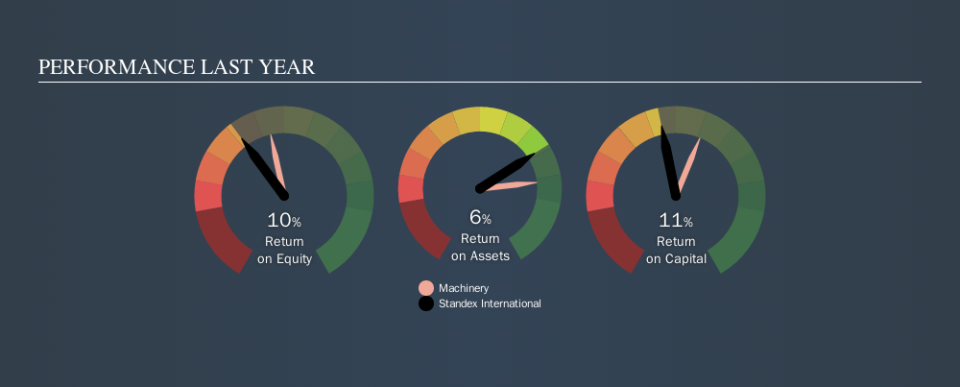
One way to assess ROCE is to compare similar companies. It appears that Standex International's ROCE is fairly close to the Machinery industry average of 12%. Setting aside the industry comparison for now, Standex International's ROCE is mediocre in absolute terms, considering the risk of investing in stocks versus the safety of a bank account. Investors may wish to consider higher-performing investments.
We can see that, Standex International currently has an ROCE of 11%, less than the 15% it reported 3 years ago. Therefore we wonder if the company is facing new headwinds. The image below shows how Standex International's ROCE compares to its industry, and you can click it to see more detail on its past growth.
When considering this metric, keep in mind that it is backwards looking, and not necessarily predictive. ROCE can be misleading for companies in cyclical industries, with returns looking impressive during the boom times, but very weak during the busts. ROCE is, after all, simply a snap shot of a single year. What happens in the future is pretty important for investors, so we have prepared a free report on analyst forecasts for Standex International.
Do Standex International's Current Liabilities Skew Its ROCE?
Current liabilities include invoices, such as supplier payments, short-term debt, or a tax bill, that need to be paid within 12 months. The ROCE equation subtracts current liabilities from capital employed, so a company with a lot of current liabilities appears to have less capital employed, and a higher ROCE than otherwise. To counter this, investors can check if a company has high current liabilities relative to total assets.
Standex International has total assets of US$922m and current liabilities of US$142m. As a result, its current liabilities are equal to approximately 15% of its total assets. This very reasonable level of current liabilities would not boost the ROCE by much.
Our Take On Standex International's ROCE
With that in mind, we're not overly impressed with Standex International's ROCE, so it may not be the most appealing prospect. But note: make sure you look for a great company, not just the first idea you come across. So take a peek at this free list of interesting companies with strong recent earnings growth (and a P/E ratio below 20).
For those who like to find winning investments this free list of growing companies with recent insider purchasing, could be just the ticket.
We aim to bring you long-term focused research analysis driven by fundamental data. Note that our analysis may not factor in the latest price-sensitive company announcements or qualitative material.
If you spot an error that warrants correction, please contact the editor at editorial-team@simplywallst.com. This article by Simply Wall St is general in nature. It does not constitute a recommendation to buy or sell any stock, and does not take account of your objectives, or your financial situation. Simply Wall St has no position in the stocks mentioned. Thank you for reading.
