What Does Sydney Airport Limited’s (ASX:SYD) P/E Ratio Tell You?

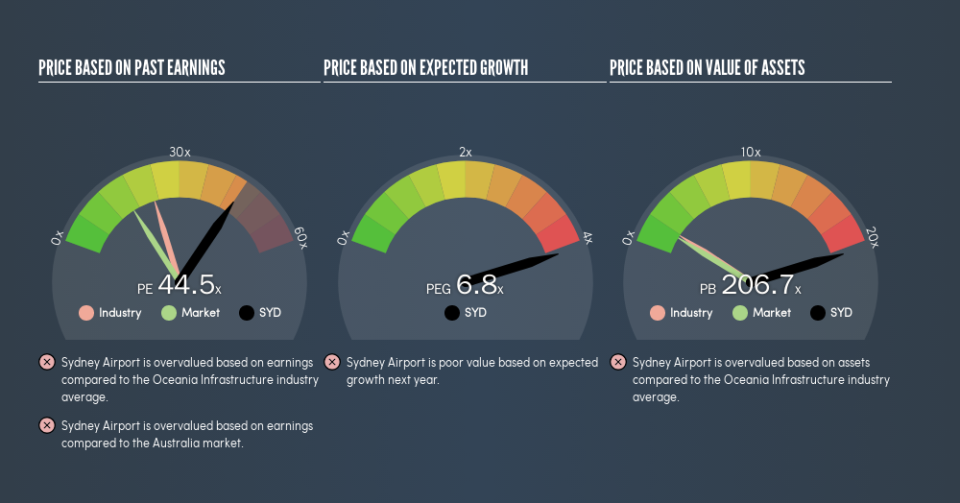
This article is written for those who want to get better at using price to earnings ratios (P/E ratios). We’ll show how you can use Sydney Airport Limited’s (ASX:SYD) P/E ratio to inform your assessment of the investment opportunity. Sydney Airport has a P/E ratio of 44.53, based on the last twelve months. In other words, at today’s prices, investors are paying A$44.53 for every A$1 in prior year profit.
See our latest analysis for Sydney Airport
How Do You Calculate Sydney Airport’s P/E Ratio?
The formula for price to earnings is:
Price to Earnings Ratio = Share Price ÷ Earnings per Share (EPS)
Or for Sydney Airport:
P/E of 44.53 = A$7.36 ÷ A$0.17 (Based on the trailing twelve months to December 2018.)
Is A High Price-to-Earnings Ratio Good?
A higher P/E ratio implies that investors pay a higher price for the earning power of the business. That isn’t necessarily good or bad, but a high P/E implies relatively high expectations of what a company can achieve in the future.
How Growth Rates Impact P/E Ratios
Earnings growth rates have a big influence on P/E ratios. Earnings growth means that in the future the ‘E’ will be higher. That means unless the share price increases, the P/E will reduce in a few years. A lower P/E should indicate the stock is cheap relative to others — and that may attract buyers.
Sydney Airport’s earnings per share grew by -6.3% in the last twelve months. And its annual EPS growth rate over 5 years is 29%.
How Does Sydney Airport’s P/E Ratio Compare To Its Peers?
The P/E ratio indicates whether the market has higher or lower expectations of a company. As you can see below, Sydney Airport has a higher P/E than the average company (22.7) in the infrastructure industry.
Sydney Airport’s P/E tells us that market participants think the company will perform better than its industry peers, going forward. Shareholders are clearly optimistic, but the future is always uncertain. So investors should delve deeper. I like to check if company insiders have been buying or selling.
Don’t Forget: The P/E Does Not Account For Debt or Bank Deposits
The ‘Price’ in P/E reflects the market capitalization of the company. That means it doesn’t take debt or cash into account. Theoretically, a business can improve its earnings (and produce a lower P/E in the future), by taking on debt (or spending its remaining cash).
Such expenditure might be good or bad, in the long term, but the point here is that the balance sheet is not reflected by this ratio.
Sydney Airport’s Balance Sheet
Net debt totals 60% of Sydney Airport’s market cap. This is enough debt that you’d have to make some adjustments before using the P/E ratio to compare it to a company with net cash.
The Bottom Line On Sydney Airport’s P/E Ratio
Sydney Airport has a P/E of 44.5. That’s higher than the average in the AU market, which is 16.1. With relatively high debt, and reasonably modest earnings per share growth over twelve months, it’s safe to say the market believes the company will improve its growth in the future.
When the market is wrong about a stock, it gives savvy investors an opportunity. As value investor Benjamin Graham famously said, ‘In the short run, the market is a voting machine but in the long run, it is a weighing machine.’ So this free report on the analyst consensus forecasts could help you make a master move on this stock.
You might be able to find a better buy than Sydney Airport. If you want a selection of possible winners, check out this free list of interesting companies that trade on a P/E below 20 (but have proven they can grow earnings).
We aim to bring you long-term focused research analysis driven by fundamental data. Note that our analysis may not factor in the latest price-sensitive company announcements or qualitative material.
If you spot an error that warrants correction, please contact the editor at editorial-team@simplywallst.com. This article by Simply Wall St is general in nature. It does not constitute a recommendation to buy or sell any stock, and does not take account of your objectives, or your financial situation. Simply Wall St has no position in the stocks mentioned. Thank you for reading.
