How Does TransUnion's (NYSE:TRU) P/E Compare To Its Industry, After Its Big Share Price Gain?

Those holding TransUnion (NYSE:TRU) shares must be pleased that the share price has rebounded 39% in the last thirty days. But unfortunately, the stock is still down by 18% over a quarter. Unfortunately, the full year gain of 7.8% wasn't so sweet.
All else being equal, a sharp share price increase should make a stock less attractive to potential investors. While the market sentiment towards a stock is very changeable, in the long run, the share price will tend to move in the same direction as earnings per share. So some would prefer to hold off buying when there is a lot of optimism towards a stock. One way to gauge market expectations of a stock is to look at its Price to Earnings Ratio (PE Ratio). A high P/E implies that investors have high expectations of what a company can achieve compared to a company with a low P/E ratio.
View our latest analysis for TransUnion
How Does TransUnion's P/E Ratio Compare To Its Peers?
TransUnion's P/E of 40.70 indicates some degree of optimism towards the stock. The image below shows that TransUnion has a higher P/E than the average (14.6) P/E for companies in the professional services industry.
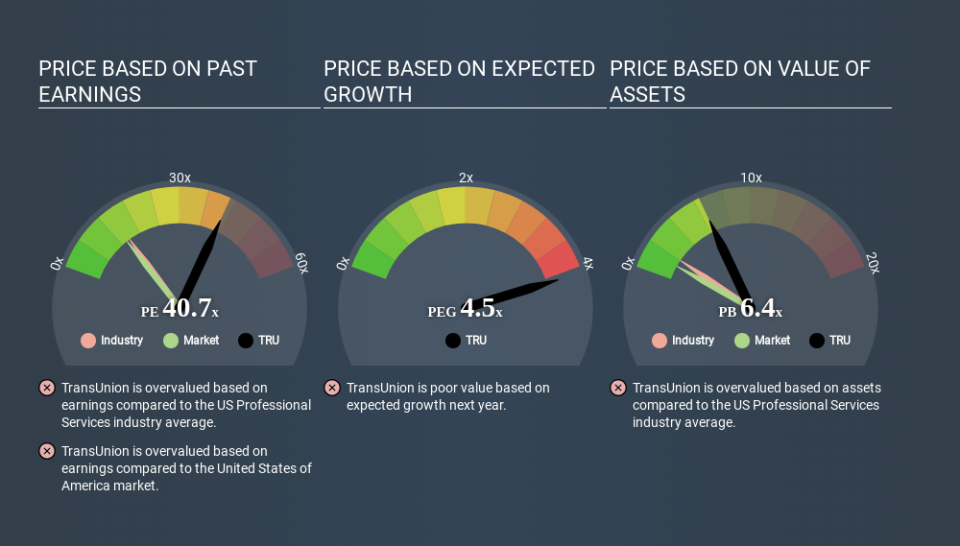
That means that the market expects TransUnion will outperform other companies in its industry. The market is optimistic about the future, but that doesn't guarantee future growth. So investors should delve deeper. I like to check if company insiders have been buying or selling.
How Growth Rates Impact P/E Ratios
Earnings growth rates have a big influence on P/E ratios. If earnings are growing quickly, then the 'E' in the equation will increase faster than it would otherwise. Therefore, even if you pay a high multiple of earnings now, that multiple will become lower in the future. And as that P/E ratio drops, the company will look cheap, unless its share price increases.
TransUnion increased earnings per share by an impressive 24% over the last twelve months. And earnings per share have improved by 42% annually, over the last three years. This could arguably justify a relatively high P/E ratio.
Remember: P/E Ratios Don't Consider The Balance Sheet
Don't forget that the P/E ratio considers market capitalization. Thus, the metric does not reflect cash or debt held by the company. In theory, a company can lower its future P/E ratio by using cash or debt to invest in growth.
Such expenditure might be good or bad, in the long term, but the point here is that the balance sheet is not reflected by this ratio.
How Does TransUnion's Debt Impact Its P/E Ratio?
TransUnion's net debt is 23% of its market cap. This could bring some additional risk, and reduce the number of investment options for management; worth remembering if you compare its P/E to businesses without debt.
The Verdict On TransUnion's P/E Ratio
TransUnion trades on a P/E ratio of 40.7, which is above its market average of 13.6. Its debt levels do not imperil its balance sheet and it is growing EPS strongly. So on this analysis it seems reasonable that its P/E ratio is above average. What is very clear is that the market has become significantly more optimistic about TransUnion over the last month, with the P/E ratio rising from 29.4 back then to 40.7 today. For those who prefer to invest with the flow of momentum, that might mean it's time to put the stock on a watchlist, or research it. But the contrarian may see it as a missed opportunity.
When the market is wrong about a stock, it gives savvy investors an opportunity. If the reality for a company is better than it expects, you can make money by buying and holding for the long term. So this free visual report on analyst forecasts could hold the key to an excellent investment decision.
Of course you might be able to find a better stock than TransUnion. So you may wish to see this free collection of other companies that have grown earnings strongly.
If you spot an error that warrants correction, please contact the editor at editorial-team@simplywallst.com. This article by Simply Wall St is general in nature. It does not constitute a recommendation to buy or sell any stock, and does not take account of your objectives, or your financial situation. Simply Wall St has no position in the stocks mentioned.
We aim to bring you long-term focused research analysis driven by fundamental data. Note that our analysis may not factor in the latest price-sensitive company announcements or qualitative material. Thank you for reading.
