How Does TRI Pointe Group's (NYSE:TPH) P/E Compare To Its Industry, After The Share Price Drop?

Unfortunately for some shareholders, the TRI Pointe Group (NYSE:TPH) share price has dived 41% in the last thirty days. Even longer term holders have taken a real hit with the stock declining 23% in the last year.
All else being equal, a share price drop should make a stock more attractive to potential investors. In the long term, share prices tend to follow earnings per share, but in the short term prices bounce around in response to short term factors (which are not always obvious). The implication here is that long term investors have an opportunity when expectations of a company are too low. One way to gauge market expectations of a stock is to look at its Price to Earnings Ratio (PE Ratio). A high P/E implies that investors have high expectations of what a company can achieve compared to a company with a low P/E ratio.
See our latest analysis for TRI Pointe Group
Does TRI Pointe Group Have A Relatively High Or Low P/E For Its Industry?
We can tell from its P/E ratio of 6.64 that sentiment around TRI Pointe Group isn't particularly high. We can see in the image below that the average P/E (8.1) for companies in the consumer durables industry is higher than TRI Pointe Group's P/E.
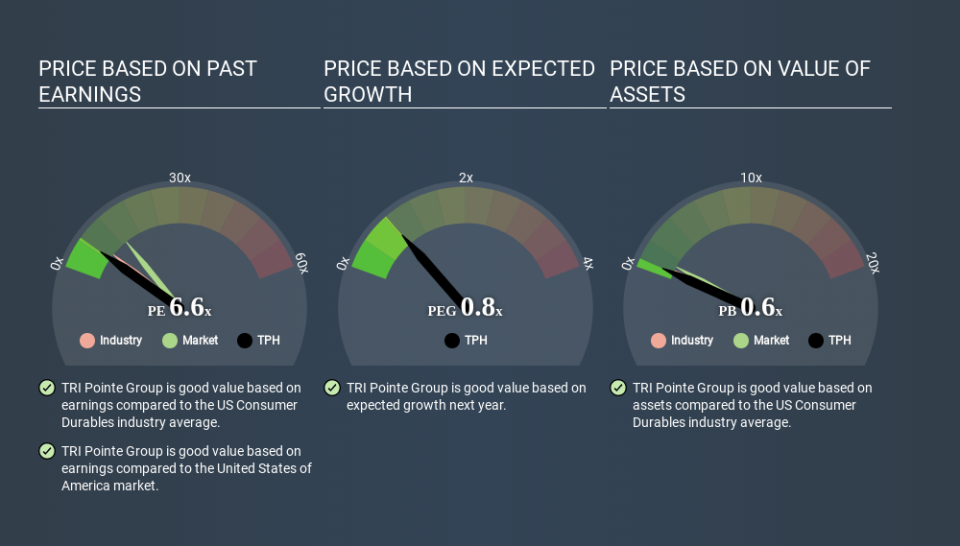
This suggests that market participants think TRI Pointe Group will underperform other companies in its industry. While current expectations are low, the stock could be undervalued if the situation is better than the market assumes. If you consider the stock interesting, further research is recommended. For example, I often monitor director buying and selling.
How Growth Rates Impact P/E Ratios
Earnings growth rates have a big influence on P/E ratios. Earnings growth means that in the future the 'E' will be higher. That means unless the share price increases, the P/E will reduce in a few years. So while a stock may look expensive based on past earnings, it could be cheap based on future earnings.
TRI Pointe Group saw earnings per share decrease by 19% last year. But it has grown its earnings per share by 20% per year over the last five years.
Remember: P/E Ratios Don't Consider The Balance Sheet
Don't forget that the P/E ratio considers market capitalization. In other words, it does not consider any debt or cash that the company may have on the balance sheet. In theory, a company can lower its future P/E ratio by using cash or debt to invest in growth.
While growth expenditure doesn't always pay off, the point is that it is a good option to have; but one that the P/E ratio ignores.
How Does TRI Pointe Group's Debt Impact Its P/E Ratio?
Net debt totals 73% of TRI Pointe Group's market cap. This is enough debt that you'd have to make some adjustments before using the P/E ratio to compare it to a company with net cash.
The Bottom Line On TRI Pointe Group's P/E Ratio
TRI Pointe Group's P/E is 6.6 which is below average (13.4) in the US market. The P/E reflects market pessimism that probably arises from the lack of recent EPS growth, paired with significant leverage. What can be absolutely certain is that the market has become more pessimistic about TRI Pointe Group over the last month, with the P/E ratio falling from 11.2 back then to 6.6 today. For those who prefer invest in growth, this stock apparently offers limited promise, but the deep value investors may find the pessimism around this stock enticing.
When the market is wrong about a stock, it gives savvy investors an opportunity. As value investor Benjamin Graham famously said, 'In the short run, the market is a voting machine but in the long run, it is a weighing machine. So this free report on the analyst consensus forecasts could help you make a master move on this stock.
But note: TRI Pointe Group may not be the best stock to buy. So take a peek at this free list of interesting companies with strong recent earnings growth (and a P/E ratio below 20).
If you spot an error that warrants correction, please contact the editor at editorial-team@simplywallst.com. This article by Simply Wall St is general in nature. It does not constitute a recommendation to buy or sell any stock, and does not take account of your objectives, or your financial situation. Simply Wall St has no position in the stocks mentioned.
We aim to bring you long-term focused research analysis driven by fundamental data. Note that our analysis may not factor in the latest price-sensitive company announcements or qualitative material. Thank you for reading.
