Does Tribune Resources Limited's (ASX:TBR) P/E Ratio Signal A Buying Opportunity?

This article is for investors who would like to improve their understanding of price to earnings ratios (P/E ratios). We'll apply a basic P/E ratio analysis to Tribune Resources Limited's (ASX:TBR), to help you decide if the stock is worth further research. Based on the last twelve months, Tribune Resources's P/E ratio is 9.72. That is equivalent to an earnings yield of about 10.3%.
See our latest analysis for Tribune Resources
How Do You Calculate A P/E Ratio?
The formula for price to earnings is:
Price to Earnings Ratio = Share Price ÷ Earnings per Share (EPS)
Or for Tribune Resources:
P/E of 9.72 = A$6.34 ÷ A$0.65 (Based on the trailing twelve months to June 2019.)
Is A High Price-to-Earnings Ratio Good?
A higher P/E ratio means that investors are paying a higher price for each A$1 of company earnings. That isn't a good or a bad thing on its own, but a high P/E means that buyers have a higher opinion of the business's prospects, relative to stocks with a lower P/E.
How Does Tribune Resources's P/E Ratio Compare To Its Peers?
One good way to get a quick read on what market participants expect of a company is to look at its P/E ratio. If you look at the image below, you can see Tribune Resources has a lower P/E than the average (12.5) in the metals and mining industry classification.
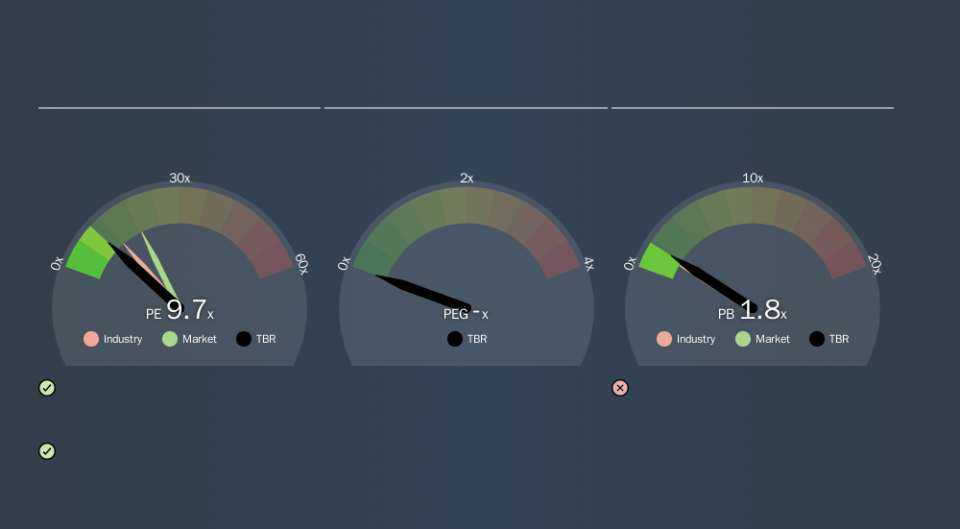
This suggests that market participants think Tribune Resources will underperform other companies in its industry. Since the market seems unimpressed with Tribune Resources, it's quite possible it could surprise on the upside. It is arguably worth checking if insiders are buying shares, because that might imply they believe the stock is undervalued.
How Growth Rates Impact P/E Ratios
Generally speaking the rate of earnings growth has a profound impact on a company's P/E multiple. When earnings grow, the 'E' increases, over time. Therefore, even if you pay a high multiple of earnings now, that multiple will become lower in the future. A lower P/E should indicate the stock is cheap relative to others -- and that may attract buyers.
Tribune Resources's earnings per share fell by 23% in the last twelve months. But EPS is up 33% over the last 5 years.
A Limitation: P/E Ratios Ignore Debt and Cash In The Bank
The 'Price' in P/E reflects the market capitalization of the company. Thus, the metric does not reflect cash or debt held by the company. Hypothetically, a company could reduce its future P/E ratio by spending its cash (or taking on debt) to achieve higher earnings.
Such spending might be good or bad, overall, but the key point here is that you need to look at debt to understand the P/E ratio in context.
How Does Tribune Resources's Debt Impact Its P/E Ratio?
Tribune Resources has net cash of AU$59m. This is fairly high at 17% of its market capitalization. That might mean balance sheet strength is important to the business, but should also help push the P/E a bit higher than it would otherwise be.
The Bottom Line On Tribune Resources's P/E Ratio
Tribune Resources has a P/E of 9.7. That's below the average in the AU market, which is 18.7. The recent drop in earnings per share would almost certainly temper expectations, the healthy balance sheet means the company retains potential for future growth. If that occurs, the current low P/E could prove to be temporary.
Investors have an opportunity when market expectations about a stock are wrong. If it is underestimating a company, investors can make money by buying and holding the shares until the market corrects itself. We don't have analyst forecasts, but you could get a better understanding of its growth by checking out this more detailed historical graph of earnings, revenue and cash flow.
Of course you might be able to find a better stock than Tribune Resources. So you may wish to see this free collection of other companies that have grown earnings strongly.
If you spot an error that warrants correction, please contact the editor at editorial-team@simplywallst.com. This article by Simply Wall St is general in nature. It does not constitute a recommendation to buy or sell any stock, and does not take account of your objectives, or your financial situation. Simply Wall St has no position in the stocks mentioned.
We aim to bring you long-term focused research analysis driven by fundamental data. Note that our analysis may not factor in the latest price-sensitive company announcements or qualitative material. Thank you for reading.
