Does WSP Global Inc. (TSE:WSP) Have A Place In Your Dividend Portfolio?

Want to participate in a short research study? Help shape the future of investing tools and you could win a $250 gift card!
Today we'll take a closer look at WSP Global Inc. (TSE:WSP) from a dividend investor's perspective. Owning a strong business and reinvesting the dividends is widely seen as an attractive way of growing your wealth. Yet sometimes, investors buy a stock for its dividend and lose money because the share price falls by more than they earned in dividend payments.
While WSP Global's 2.1% dividend yield is not the highest, we think its lengthy payment history is quite interesting. Before you buy any stock for its dividend however, you should always remember Warren Buffett's two rules: 1) Don't lose money, and 2) Remember rule #1. We'll run through some checks below to help with this.
Explore this interactive chart for our latest analysis on WSP Global!
Payout ratios
Companies (usually) pay dividends out of their earnings. If a company is paying more than it earns, the dividend might have to be cut. Comparing dividend payments to a company's net profit after tax is a simple way of reality-checking whether a dividend is sustainable. In the last year, WSP Global paid out 60% of its profit as dividends. This is a healthy payout ratio, and while it does limit the amount of earnings that can be reinvested in the business, there is also some room to lift the payout ratio over time.
Another important check we do is to see if the free cash flow generated is sufficient to pay the dividend. WSP Global's cash payout ratio last year was 15%. Cash flows are typically lumpy, but this looks like an appropriately conservative payout. It's positive to see that WSP Global's dividend is covered by both profits and cash flow, since this is generally a sign that the dividend is sustainable, and a lower payout ratio usually suggests a greater margin of safety before the dividend gets cut.
Is WSP Global's Balance Sheet Risky?
As WSP Global has a meaningful amount of debt, we need to check its balance sheet to see if the company might have debt risks. A quick way to check a company's financial situation uses these two ratios: net debt divided by EBITDA (earnings before interest, tax, depreciation and amortisation), and net interest cover. Net debt to EBITDA is a measure of a company's total debt. Net interest cover measures the ability to meet interest payments on debt. Essentially we check that a) a company does not have too much debt, and b) that it can afford to pay the interest. WSP Global is carrying net debt of 3.87 times its EBITDA, which is getting towards the upper limit of our comfort range on a dividend stock that the investor hopes will endure a wide range of economic circumstances.
Net interest cover can be calculated by dividing earnings before interest and tax (EBIT) by the company's net interest expense. WSP Global has EBIT of 6.94 times its interest expense, which we think is adequate.
Consider getting our latest analysis on WSP Global's financial position here.
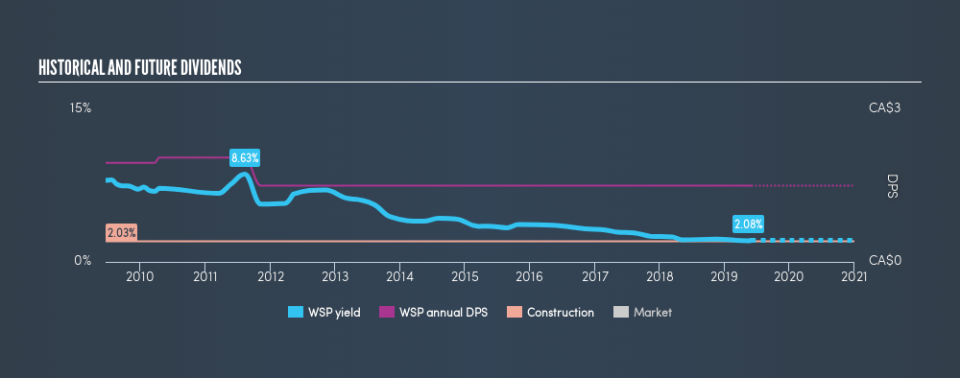
Dividend Volatility
From the perspective of an income investor who wants to earn dividends for many years, there is not much point buying a stock if its dividend is regularly cut or is not reliable. For the purpose of this article, we only scrutinise the last decade of WSP Global's dividend payments. This dividend has been unstable, which we define as having fallen by at least 20% one or more times over this time. During the past ten-year period, the first annual payment was CA$1.95 in 2009, compared to CA$1.50 last year. This works out to be a decline of approximately 2.6% per year over that time. WSP Global's dividend hasn't shrunk linearly at 2.6% per annum, but the CAGR is a useful estimate of the historical rate of change.
A shrinking dividend over a ten-year period is not ideal, and we'd be concerned about investing in a dividend stock that lacks a solid record of growing dividends per share.
Dividend Growth Potential
With a relatively unstable dividend, it's even more important to see if earnings per share (EPS) are growing. Why take the risk of a dividend getting cut, unless there's a good chance of bigger dividends in future? It's good to see WSP Global has been growing its earnings per share at 13% a year over the past 5 years. Earnings per share have been growing rapidly, but given that it is paying out more than half of its earnings as dividends, we wonder how WSP Global will keep funding its growth projects in the future.
Conclusion
When we look at a dividend stock, we need to form a judgement on whether the dividend will grow, if the company is able to maintain it in a wide range of economic circumstances, and if the dividend payout is sustainable. WSP Global's payout ratios are within a normal range for the average corporation, and we like that its cashflow was stronger than reported profits. We were also glad to see it growing earnings, but it was concerning to see the dividend has been cut at least once in the past. WSP Global has a number of positive attributes, but it falls slightly short of our (admittedly high) standards. Were there evidence of a strong moat or an attractive valuation, it could still be well worth a look.
Companies that are growing earnings tend to be the best dividend stocks over the long term. See what the 12 analysts we track are forecasting for WSP Global for free with public analyst estimates for the company.
If you are a dividend investor, you might also want to look at our curated list of dividend stocks yielding above 3%.
We aim to bring you long-term focused research analysis driven by fundamental data. Note that our analysis may not factor in the latest price-sensitive company announcements or qualitative material.
If you spot an error that warrants correction, please contact the editor at editorial-team@simplywallst.com. This article by Simply Wall St is general in nature. It does not constitute a recommendation to buy or sell any stock, and does not take account of your objectives, or your financial situation. Simply Wall St has no position in the stocks mentioned. Thank you for reading.
