How Does XRF Scientific's (ASX:XRF) P/E Compare To Its Industry, After Its Big Share Price Gain?

Those holding XRF Scientific (ASX:XRF) shares must be pleased that the share price has rebounded 33% in the last thirty days. But unfortunately, the stock is still down by 17% over a quarter. Unfortunately, the full year gain of 8.1% wasn't so sweet.
Assuming no other changes, a sharply higher share price makes a stock less attractive to potential buyers. In the long term, share prices tend to follow earnings per share, but in the short term prices bounce around in response to short term factors (which are not always obvious). The implication here is that deep value investors might steer clear when expectations of a company are too high. Perhaps the simplest way to get a read on investors' expectations of a business is to look at its Price to Earnings Ratio (PE Ratio). Investors have optimistic expectations of companies with higher P/E ratios, compared to companies with lower P/E ratios.
Check out our latest analysis for XRF Scientific
How Does XRF Scientific's P/E Ratio Compare To Its Peers?
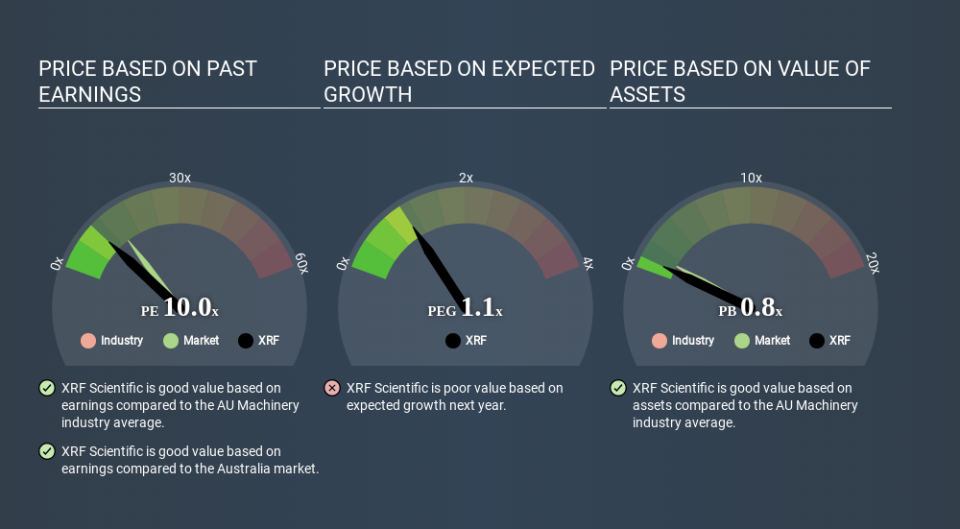
XRF Scientific's P/E is 9.96. You can see in the image below that the average P/E (10.3) for companies in the machinery industry is roughly the same as XRF Scientific's P/E.
XRF Scientific's P/E tells us that market participants think its prospects are roughly in line with its industry. The company could surprise by performing better than average, in the future. I would further inform my view by checking insider buying and selling., among other things.
How Growth Rates Impact P/E Ratios
Probably the most important factor in determining what P/E a company trades on is the earnings growth. When earnings grow, the 'E' increases, over time. That means unless the share price increases, the P/E will reduce in a few years. A lower P/E should indicate the stock is cheap relative to others -- and that may attract buyers.
XRF Scientific's earnings made like a rocket, taking off 71% last year. And earnings per share have improved by 39% annually, over the last three years. So we'd absolutely expect it to have a relatively high P/E ratio.
Don't Forget: The P/E Does Not Account For Debt or Bank Deposits
It's important to note that the P/E ratio considers the market capitalization, not the enterprise value. So it won't reflect the advantage of cash, or disadvantage of debt. Hypothetically, a company could reduce its future P/E ratio by spending its cash (or taking on debt) to achieve higher earnings.
Such spending might be good or bad, overall, but the key point here is that you need to look at debt to understand the P/E ratio in context.
Is Debt Impacting XRF Scientific's P/E?
XRF Scientific's net debt is 11% of its market cap. That's enough debt to impact the P/E ratio a little; so keep it in mind if you're comparing it to companies without debt.
The Bottom Line On XRF Scientific's P/E Ratio
XRF Scientific's P/E is 10.0 which is below average (14.1) in the AU market. The company hasn't stretched its balance sheet, and earnings growth was good last year. If the company can continue to grow earnings, then the current P/E may be unjustifiably low. Since analysts are predicting growth will continue, one might expect to see a higher P/E so it may be worth looking closer. What we know for sure is that investors are becoming less uncomfortable about XRF Scientific's prospects, since they have pushed its P/E ratio from 7.5 to 10.0 over the last month. If you like to buy stocks that could be turnaround opportunities, then this one might be a candidate; but if you're more sensitive to price, then you may feel the opportunity has passed.
Investors should be looking to buy stocks that the market is wrong about. As value investor Benjamin Graham famously said, 'In the short run, the market is a voting machine but in the long run, it is a weighing machine. So this free visual report on analyst forecasts could hold the key to an excellent investment decision.
Of course, you might find a fantastic investment by looking at a few good candidates. So take a peek at this free list of companies with modest (or no) debt, trading on a P/E below 20.
If you spot an error that warrants correction, please contact the editor at editorial-team@simplywallst.com. This article by Simply Wall St is general in nature. It does not constitute a recommendation to buy or sell any stock, and does not take account of your objectives, or your financial situation. Simply Wall St has no position in the stocks mentioned.
We aim to bring you long-term focused research analysis driven by fundamental data. Note that our analysis may not factor in the latest price-sensitive company announcements or qualitative material. Thank you for reading.
