How Does XXL's (OB:XXL) P/E Compare To Its Industry, After The Share Price Drop?

To the annoyance of some shareholders, XXL (OB:XXL) shares are down a considerable 31% in the last month. That drop has capped off a tough year for shareholders, with the share price down 59% in that time.
Assuming nothing else has changed, a lower share price makes a stock more attractive to potential buyers. While the market sentiment towards a stock is very changeable, in the long run, the share price will tend to move in the same direction as earnings per share. So, on certain occasions, long term focussed investors try to take advantage of pessimistic expectations to buy shares at a better price. Perhaps the simplest way to get a read on investors' expectations of a business is to look at its Price to Earnings Ratio (PE Ratio). A high P/E ratio means that investors have a high expectation about future growth, while a low P/E ratio means they have low expectations about future growth.
See our latest analysis for XXL
How Does XXL's P/E Ratio Compare To Its Peers?
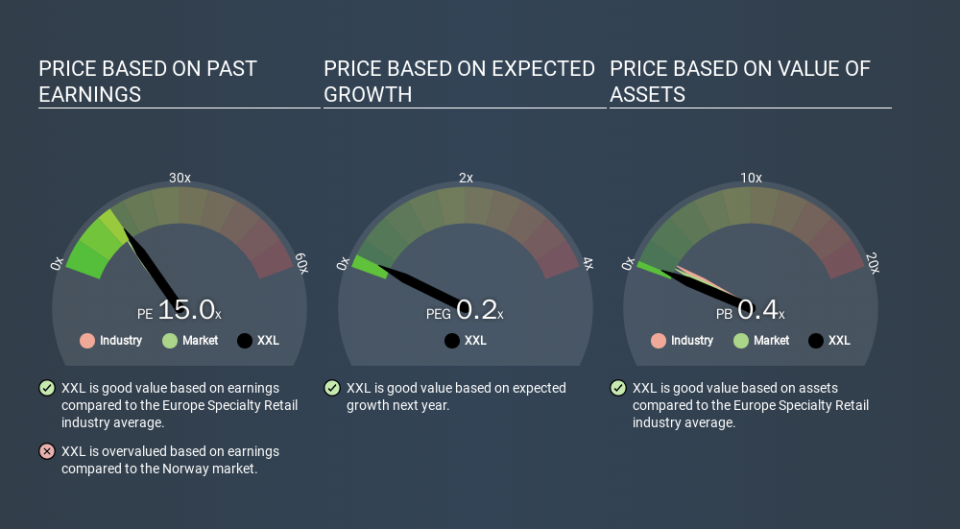
XXL has a P/E ratio of 15.04. You can see in the image below that the average P/E (15.0) for companies in the specialty retail industry is roughly the same as XXL's P/E.
XXL's P/E tells us that market participants think its prospects are roughly in line with its industry. So if XXL actually outperforms its peers going forward, that should be a positive for the share price. I would further inform my view by checking insider buying and selling., among other things.
How Growth Rates Impact P/E Ratios
If earnings fall then in the future the 'E' will be lower. That means even if the current P/E is low, it will increase over time if the share price stays flat. Then, a higher P/E might scare off shareholders, pushing the share price down.
XXL's earnings per share fell by 75% in the last twelve months. But EPS is up 1.5% over the last 5 years. And it has shrunk its earnings per share by 36% per year over the last three years. This growth rate might warrant a low P/E ratio.
A Limitation: P/E Ratios Ignore Debt and Cash In The Bank
Don't forget that the P/E ratio considers market capitalization. So it won't reflect the advantage of cash, or disadvantage of debt. In theory, a company can lower its future P/E ratio by using cash or debt to invest in growth.
Spending on growth might be good or bad a few years later, but the point is that the P/E ratio does not account for the option (or lack thereof).
So What Does XXL's Balance Sheet Tell Us?
XXL's net debt is 97% of its market cap. This is a reasonably significant level of debt -- all else being equal you'd expect a much lower P/E than if it had net cash.
The Bottom Line On XXL's P/E Ratio
XXL trades on a P/E ratio of 15.0, which is above its market average of 13.9. With relatively high debt, and no earnings per share growth over twelve months, it's safe to say the market believes the company will improve its earnings growth in the future. What can be absolutely certain is that the market has become significantly less optimistic about XXL over the last month, with the P/E ratio falling from 21.9 back then to 15.0 today. For those who don't like to trade against momentum, that could be a warning sign, but a contrarian investor might want to take a closer look.
When the market is wrong about a stock, it gives savvy investors an opportunity. If the reality for a company is better than it expects, you can make money by buying and holding for the long term. So this free visual report on analyst forecasts could hold the key to an excellent investment decision.
Of course, you might find a fantastic investment by looking at a few good candidates. So take a peek at this free list of companies with modest (or no) debt, trading on a P/E below 20.
If you spot an error that warrants correction, please contact the editor at editorial-team@simplywallst.com. This article by Simply Wall St is general in nature. It does not constitute a recommendation to buy or sell any stock, and does not take account of your objectives, or your financial situation. Simply Wall St has no position in the stocks mentioned.
We aim to bring you long-term focused research analysis driven by fundamental data. Note that our analysis may not factor in the latest price-sensitive company announcements or qualitative material. Thank you for reading.
