Dollar Hits 3-Month Low, SPX 500 Sets New Record High
Talking Points
US Dollar Sinks to 3-Month Low, Threatens Key Trend Support
S&P 500 Soars Past August Top to Set a New Record High
Gold Recoils Higher from 1300/oz Figure After FOMC Outcome
To receive Ilya's analysis directly via email, please SIGN UP HERE
Can’t access to the Dow Jones FXCM US Dollar Index? Try the USD basket on Mirror Trader. **
US DOLLAR TECHNICAL ANALYSIS – Prices plunged to meet support in the 10449-69 area marked by the June 13 low, the 100% Fibonacci expansion and a rising trend line set from September 2012. A break below this boundary targets the 123.6% level at 10363. Near-term resistance is in the 10524-35 region, bracketed by the underside of a broken falling channel bottom and the 76.4% expansion.
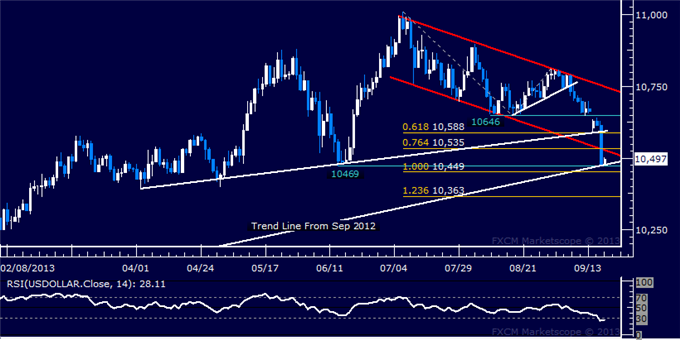
Daily Chart - Created Using FXCM Marketscope 2.0
** The Dow Jones FXCM US Dollar Index and the Mirror Trader USD basket are not the same product.
S&P 500 TECHNICAL ANALYSIS – Prices broke through the 61.8% Fibonacci expansion at 1719.60 to set a new record high. Buyers now aim to challenge the 76.4% level at 1741.60, with a breach above that eyeing the 100% level at 1777.10. The 1719.60 mark has been recast as near-term support, followed by the August 2 high at 1709.60.
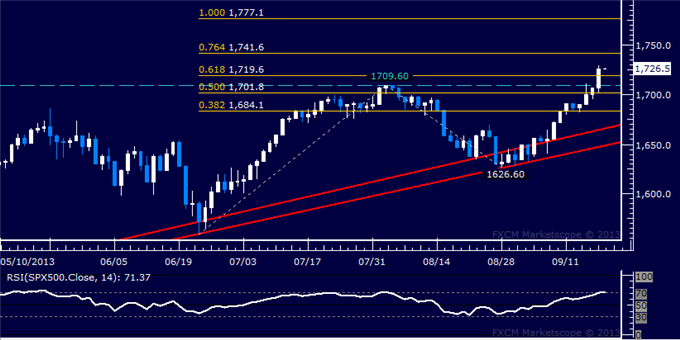
Daily Chart - Created Using FXCM Marketscope 2.0
GOLD TECHNICAL ANALYSIS – Prices recoiled from support at 1306.88, the 50% Fibonacci retracement and surged sharply higher to test trend line resistance at 1364.48. This barrier is reinforced by the underside of a recently broken rising channel now at 1376.56. A break above the latter barrier targets the 38.2% Fib expansion at 1388.36. Near-term support is in the 1336.79-47.52 area, marked by a horizontal pivot level in play since mid-April and the 38.2% retracement.
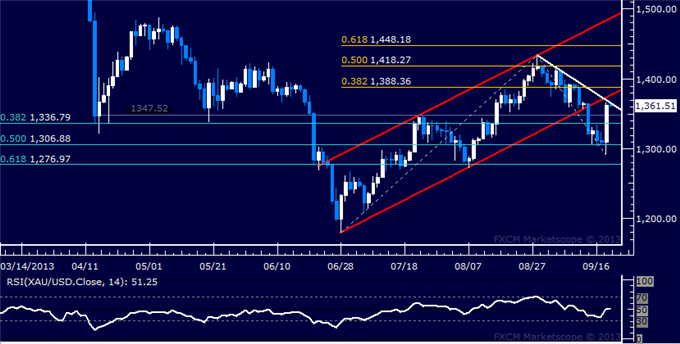
Daily Chart - Created Using FXCM Marketscope 2.0
CRUDE OIL TECHNICAL ANALYSIS– Prices are bouncing from support at the bottom of a rising channel set from late July, eyeing resistance in at 111.21 marked by the formation’s top and the 23.6% Fibonacci expansion. Channel support is now at 105.32, with added reinforcement from a rising trend line at 103.16.
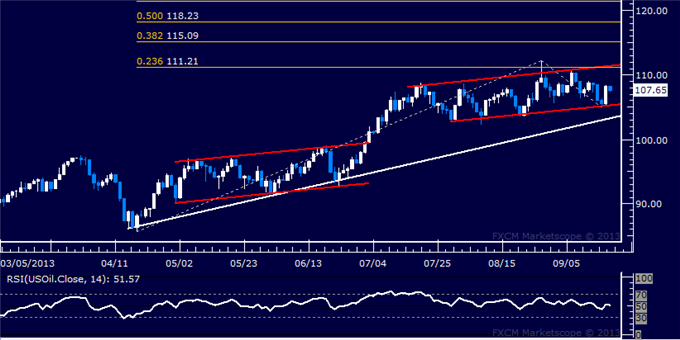
Daily Chart - Created Using FXCM Marketscope 2.0
--- Written by Ilya Spivak, Currency Strategist for DailyFX.com
Contact and follow Ilya on Twitter: @IlyaSpivak
For live market updates, visit the Real Time News Feed
DailyFX provides forex news and technical analysis on the trends that influence the global currency markets.
Learn forex trading with a free practice account and trading charts from FXCM.
