Dollar at Key Resistance, S&P 500 Rally May Lose Steam
THE TAKEAWAY: The US Dollar is testing trend-defining technical resistance while the S&P 500 is showing early signs of exhaustion after hitting a five-year high.
US DOLLAR TECHNICAL ANALYSIS– Prices recovered from support in the 10141-53 area, marked by a former resistance level and the 50%Fibonacci expansion, to challenge the top of a rising channel set from mid-September (10201). A break above this boundary targets the 76.4% Fib at 10216. Near-term support is at the 61.8% level (10181), with a reversal below that eyeing the 10141-53 region anew.

Daily Chart - Created Using FXCM Marketscope 2.0
S&P 500 TECHNICAL ANALYSIS – Prices pushed to the highest level since December 2007 last week as the bulls advance toward resistance at 1521.20, marked by the 123.6% Fibonacci expansion. A break above that exposes the 138.2% level at 1537.20. Near-term support is at 1495.90, the 100% Fib, with a reversal back below that targeting the 1470.50-74.90 area.
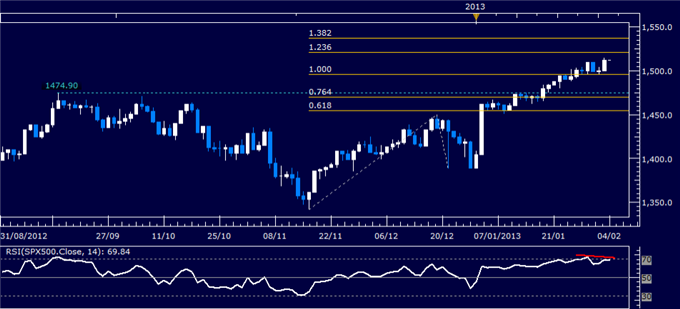
Daily Chart - Created Using FXCM Marketscope 2.0
GOLD TECHNICAL ANALYSIS – Prices continue to hover above rising trend line support dating back to mid-May (1655.63), with a bullish Morning Star candlestick pattern arguing for an upside bias. Near-term resistance is at 1690.39, the 38.2% Fibonacci retracement, followed by a falling channel top at 1698.28. Alternatively, a drop below support targets the January 4 low at 1625.69 and the channel bottom (now right at the 1600/oz figure).

Daily Chart - Created Using FXCM Marketscope 2.0
CRUDE OIL TECHNICAL ANALYSIS– Prices appear to be carving out a bearish Rising Wedge chart formation, with a Dark Cloud Cover candlestick pattern and negative RSI divergence hinting the turn lower may be just around the corner. A break of wedge support at 97.36 targets the 93.40-94.61 area. Near-term resistance is at 98.21, the January 30 high, with a reversal above that eyeing the 100.00 figure and the September 14 top at 100.40.
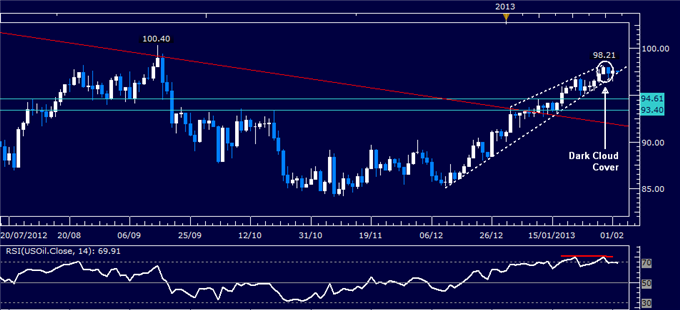
Daily Chart - Created Using FXCM Marketscope 2.0
--- Written by Ilya Spivak, Currency Strategist for Dailyfx.com
To contact Ilya, e-mail ispivak@dailyfx.com. Follow Ilya on Twitter at @IlyaSpivak
To be added to Ilya's e-mail distribution list, please CLICK HERE
DailyFX provides forex news and technical analysis on the trends that influence the global currency markets.
Learn forex trading with a free practice account and trading charts from FXCM.
