Dollar Mounts Recovery as S&P 500 Sets New 6-Week Low
THE TAKEAWAY: The US Dollar is attempting to launch a recovery after another test of Augusts’ swing bottom while the S&P 500 has set a new six-week low.
Don’t have access to the Dow Jones FXCM US Dollar Index? Try the USD basket via Mirror Trader as an alternative. **
US DOLLAR TECHNICAL ANALYSIS – Prices recovered from support at 10650, the August 8 low, taking out resistance atthe 23.6% Fibonacci expansion (10708). Bulls are now testing the 38.2% level at 10744, with a push above this exposing the 50% Fib at 10774. The 10708 mark has been recast as near-term support, with a move back beneath that eyeing 10650 anew.
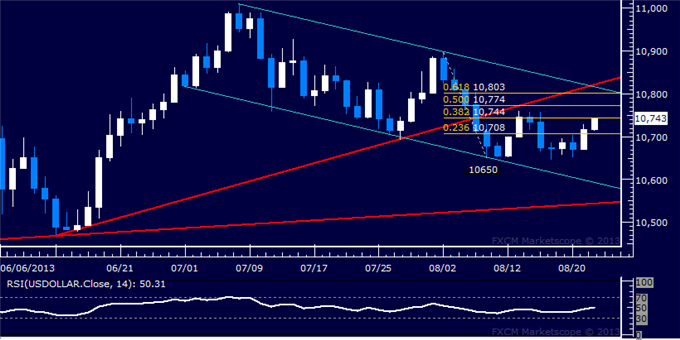
Daily Chart - Created Using FXCM Marketscope 2.0
** The Dow Jones FXCM US Dollar Index and the Mirror Trader USD basket are not the same product.
S&P 500 TECHNICAL ANALYSIS – Prices declined as expected after putting in a Hanging Man candlestick. Sellers are now testing support at 1634.30, the 50% Fibonacci retracement, with a break beneath that targeting the 61.8% level at 1616.60. Near-term resistance is at 1652.10, the 38.2% Fib.
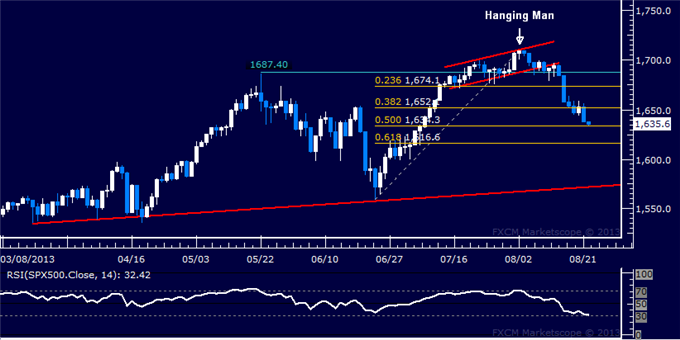
Daily Chart - Created Using FXCM Marketscope 2.0
GOLD TECHNICAL ANALYSIS – Prices put in a bearish Dark Cloud Cover candlestick pattern below resistance at 1376.28, the 61.8% Fibonacci expansion, hinting a reversal lower may be ahead. Negative RSI divergence bolsters the case for a downside scenario. Near-term support is at 1356.22, the 50% Fib, with a break beneath that targeting the 38.2% level at 1336.76. Alternatively, a reversal above 1376.28 aims for the 76.4% expansion at 1400.72.
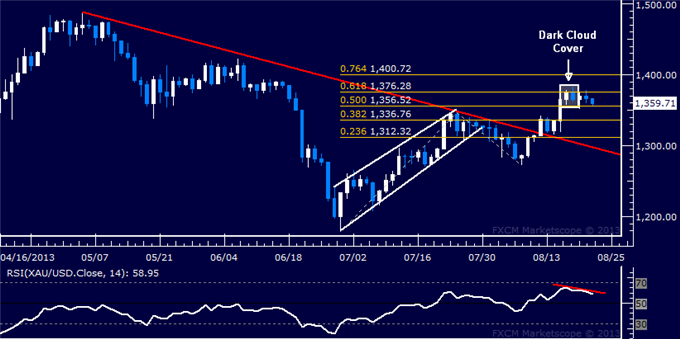
Daily Chart - Created Using FXCM Marketscope 2.0
CRUDE OIL TECHNICAL ANALYSIS– Prices pulled back after putting in a Bearish Engulfing candlestick pattern, taking out the bottom of a Triangle chart pattern to expose the 38.2% Fibonacci retracement at 102.70. A further push beneath that eyes the 50% level at 100.79. Alternatively, a turn back above the Triangle top (now at 104.80) aims for the formation’s upper boundary at 108.05.
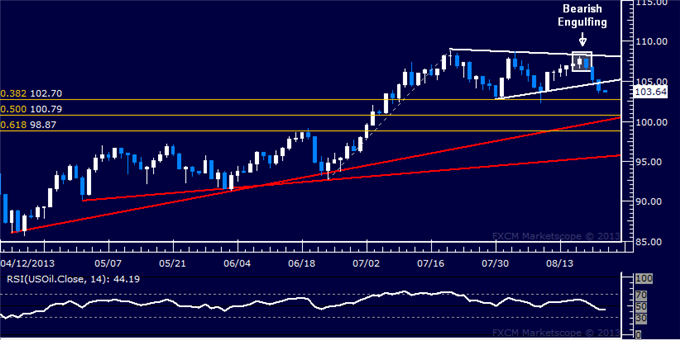
Daily Chart - Created Using FXCM Marketscope 2.0
--- Written by Ilya Spivak, Currency Strategist for Dailyfx.com
To contact Ilya, e-mail ispivak@dailyfx.com. Follow Ilya on Twitter at @IlyaSpivak
To be added to Ilya's e-mail distribution list, please CLICK HERE
New to FX? Watch this Video. For live market updates, visit the Real Time News Feed
DailyFX provides forex news and technical analysis on the trends that influence the global currency markets.
Learn forex trading with a free practice account and trading charts from FXCM.
