Are Dollarama Inc.’s (TSE:DOL) High Returns Really That Great?

Today we'll look at Dollarama Inc. (TSE:DOL) and reflect on its potential as an investment. In particular, we'll consider its Return On Capital Employed (ROCE), as that can give us insight into how profitably the company is able to employ capital in its business.
First up, we'll look at what ROCE is and how we calculate it. Then we'll compare its ROCE to similar companies. Last but not least, we'll look at what impact its current liabilities have on its ROCE.
Understanding Return On Capital Employed (ROCE)
ROCE is a metric for evaluating how much pre-tax income (in percentage terms) a company earns on the capital invested in its business. All else being equal, a better business will have a higher ROCE. Ultimately, it is a useful but imperfect metric. Author Edwin Whiting says to be careful when comparing the ROCE of different businesses, since 'No two businesses are exactly alike.
So, How Do We Calculate ROCE?
The formula for calculating the return on capital employed is:
Return on Capital Employed = Earnings Before Interest and Tax (EBIT) ÷ (Total Assets - Current Liabilities)
Or for Dollarama:
0.28 = CA$822m ÷ (CA$3.7b - CA$803m) (Based on the trailing twelve months to November 2019.)
So, Dollarama has an ROCE of 28%.
Check out our latest analysis for Dollarama
Does Dollarama Have A Good ROCE?
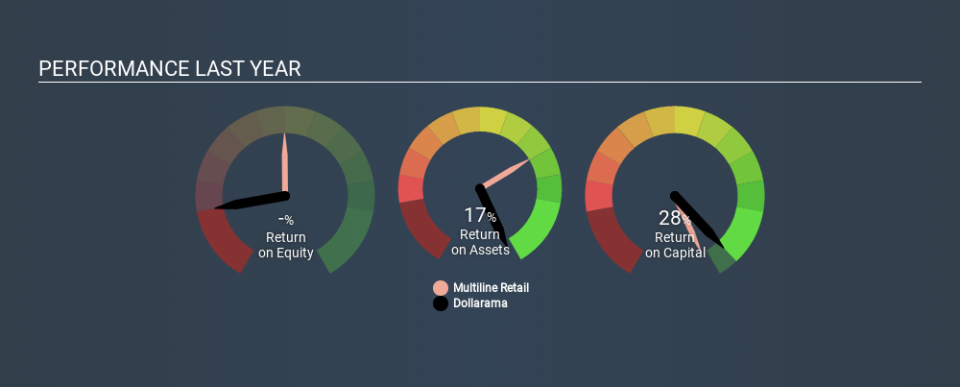
One way to assess ROCE is to compare similar companies. In our analysis, Dollarama's ROCE is meaningfully higher than the 11% average in the Multiline Retail industry. I think that's good to see, since it implies the company is better than other companies at making the most of its capital. Setting aside the comparison to its industry for a moment, Dollarama's ROCE in absolute terms currently looks quite high.
Dollarama's current ROCE of 28% is lower than 3 years ago, when the company reported a 44% ROCE. This makes us wonder if the business is facing new challenges. The image below shows how Dollarama's ROCE compares to its industry, and you can click it to see more detail on its past growth.
Remember that this metric is backwards looking - it shows what has happened in the past, and does not accurately predict the future. ROCE can be deceptive for cyclical businesses, as returns can look incredible in boom times, and terribly low in downturns. ROCE is, after all, simply a snap shot of a single year. What happens in the future is pretty important for investors, so we have prepared a free report on analyst forecasts for Dollarama.
How Dollarama's Current Liabilities Impact Its ROCE
Short term (or current) liabilities, are things like supplier invoices, overdrafts, or tax bills that need to be paid within 12 months. The ROCE equation subtracts current liabilities from capital employed, so a company with a lot of current liabilities appears to have less capital employed, and a higher ROCE than otherwise. To check the impact of this, we calculate if a company has high current liabilities relative to its total assets.
Dollarama has total assets of CA$3.7b and current liabilities of CA$803m. As a result, its current liabilities are equal to approximately 22% of its total assets. A minimal amount of current liabilities limits the impact on ROCE.
The Bottom Line On Dollarama's ROCE
Low current liabilities and high ROCE is a good combination, making Dollarama look quite interesting. There might be better investments than Dollarama out there, but you will have to work hard to find them . These promising businesses with rapidly growing earnings might be right up your alley.
If you are like me, then you will not want to miss this free list of growing companies that insiders are buying.
If you spot an error that warrants correction, please contact the editor at editorial-team@simplywallst.com. This article by Simply Wall St is general in nature. It does not constitute a recommendation to buy or sell any stock, and does not take account of your objectives, or your financial situation. Simply Wall St has no position in the stocks mentioned.
We aim to bring you long-term focused research analysis driven by fundamental data. Note that our analysis may not factor in the latest price-sensitive company announcements or qualitative material. Thank you for reading.
