Don’t Buy Evergy, Inc. (NYSE:EVRG) Until You Understand Its ROCE

Today we'll evaluate Evergy, Inc. (NYSE:EVRG) to determine whether it could have potential as an investment idea. Specifically, we're going to calculate its Return On Capital Employed (ROCE), in the hopes of getting some insight into the business.
Firstly, we'll go over how we calculate ROCE. Then we'll compare its ROCE to similar companies. Finally, we'll look at how its current liabilities affect its ROCE.
What is Return On Capital Employed (ROCE)?
ROCE measures the amount of pre-tax profits a company can generate from the capital employed in its business. In general, businesses with a higher ROCE are usually better quality. In brief, it is a useful tool, but it is not without drawbacks. Author Edwin Whiting says to be careful when comparing the ROCE of different businesses, since 'No two businesses are exactly alike.
So, How Do We Calculate ROCE?
The formula for calculating the return on capital employed is:
Return on Capital Employed = Earnings Before Interest and Tax (EBIT) ÷ (Total Assets - Current Liabilities)
Or for Evergy:
0.046 = US$1.1b ÷ (US$26b - US$2.1b) (Based on the trailing twelve months to September 2019.)
So, Evergy has an ROCE of 4.6%.
Check out our latest analysis for Evergy
Is Evergy's ROCE Good?
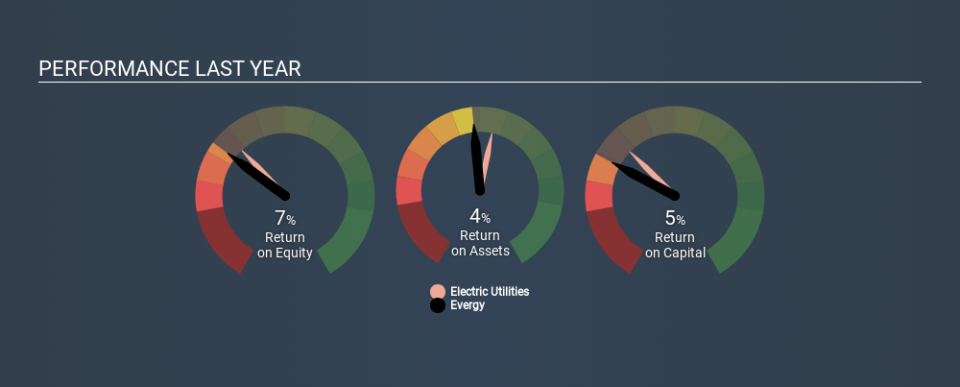
One way to assess ROCE is to compare similar companies. It appears that Evergy's ROCE is fairly close to the Electric Utilities industry average of 4.6%. Putting aside Evergy's performance relative to its industry, its ROCE in absolute terms is poor - considering the risk of owning stocks compared to government bonds. There are potentially more appealing investments elsewhere.
We can see that, Evergy currently has an ROCE of 4.6%, less than the 6.5% it reported 3 years ago. So investors might consider if it has had issues recently. You can see in the image below how Evergy's ROCE compares to its industry. Click to see more on past growth.
Remember that this metric is backwards looking - it shows what has happened in the past, and does not accurately predict the future. ROCE can be deceptive for cyclical businesses, as returns can look incredible in boom times, and terribly low in downturns. ROCE is only a point-in-time measure. Since the future is so important for investors, you should check out our free report on analyst forecasts for Evergy.
Do Evergy's Current Liabilities Skew Its ROCE?
Short term (or current) liabilities, are things like supplier invoices, overdrafts, or tax bills that need to be paid within 12 months. The ROCE equation subtracts current liabilities from capital employed, so a company with a lot of current liabilities appears to have less capital employed, and a higher ROCE than otherwise. To counter this, investors can check if a company has high current liabilities relative to total assets.
Evergy has total liabilities of US$2.1b and total assets of US$26b. As a result, its current liabilities are equal to approximately 8.0% of its total assets. With barely any current liabilities, there is minimal impact on Evergy's admittedly low ROCE.
Our Take On Evergy's ROCE
Nonetheless, there may be better places to invest your capital. Of course, you might also be able to find a better stock than Evergy. So you may wish to see this free collection of other companies that have grown earnings strongly.
I will like Evergy better if I see some big insider buys. While we wait, check out this free list of growing companies with considerable, recent, insider buying.
If you spot an error that warrants correction, please contact the editor at editorial-team@simplywallst.com. This article by Simply Wall St is general in nature. It does not constitute a recommendation to buy or sell any stock, and does not take account of your objectives, or your financial situation. Simply Wall St has no position in the stocks mentioned.
We aim to bring you long-term focused research analysis driven by fundamental data. Note that our analysis may not factor in the latest price-sensitive company announcements or qualitative material. Thank you for reading.
