Don’t Sell Howden Joinery Group Plc (LON:HWDN) Before You Read This

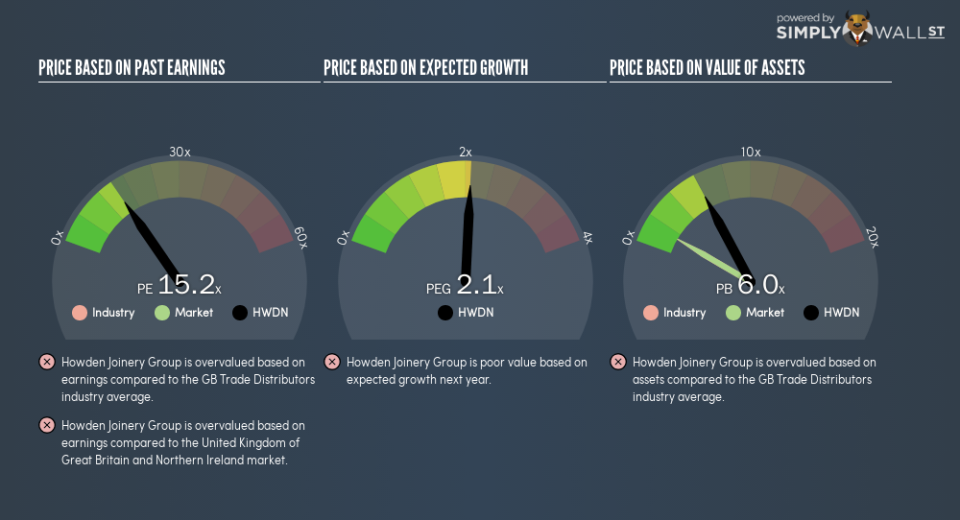
This article is for investors who would like to improve their understanding of price to earnings ratios (P/E ratios). To keep it practical, we’ll show how Howden Joinery Group Plc’s (LON:HWDN) P/E ratio could help you assess the value on offer. Based on the last twelve months, Howden Joinery Group’s P/E ratio is 15.24. That is equivalent to an earnings yield of about 6.6%.
Check out our latest analysis for Howden Joinery Group
How Do You Calculate A P/E Ratio?
The formula for P/E is:
Price to Earnings Ratio = Share Price ÷ Earnings per Share (EPS)
Or for Howden Joinery Group:
P/E of 15.24 = £4.66 ÷ £0.31 (Based on the year to June 2018.)
Is A High P/E Ratio Good?
A higher P/E ratio means that investors are paying a higher price for each £1 of company earnings. All else being equal, it’s better to pay a low price — but as Warren Buffett said, ‘It’s far better to buy a wonderful company at a fair price than a fair company at a wonderful price.’
How Growth Rates Impact P/E Ratios
P/E ratios primarily reflect market expectations around earnings growth rates. That’s because companies that grow earnings per share quickly will rapidly increase the ‘E’ in the equation. That means even if the current P/E is high, it will reduce over time if the share price stays flat. So while a stock may look expensive based on past earnings, it could be cheap based on future earnings.
Howden Joinery Group increased earnings per share by 6.1% last year. And its annual EPS growth rate over 5 years is 14%.
How Does Howden Joinery Group’s P/E Ratio Compare To Its Peers?
We can get an indication of market expectations by looking at the P/E ratio. As you can see below Howden Joinery Group has a P/E ratio that is fairly close for the average for the trade distributors industry, which is 14.8.
Howden Joinery Group’s P/E tells us that market participants think its prospects are roughly in line with its industry. So if Howden Joinery Group actually outperforms its peers going forward, that should be a positive for the share price. Checking factors such as the tenure of the board and management could help you form your own view on if that will happen.
Remember: P/E Ratios Don’t Consider The Balance Sheet
It’s important to note that the P/E ratio considers the market capitalization, not the enterprise value. In other words, it does not consider any debt or cash that the company may have on the balance sheet. In theory, a company can lower its future P/E ratio by using cash or debt to invest in growth.
Spending on growth might be good or bad a few years later, but the point is that the P/E ratio does not account for the option (or lack thereof).
Is Debt Impacting Howden Joinery Group’s P/E?
Since Howden Joinery Group holds net cash of UK£213m, it can spend on growth, justifying a higher P/E ratio than otherwise.
The Verdict On Howden Joinery Group’s P/E Ratio
Howden Joinery Group has a P/E of 15.2. That’s around the same as the average in the GB market, which is 15.4. Recent earnings growth wasn’t bad. And the healthy balance sheet means the company can sustain growth. But the P/E suggests shareholders have some doubts.
Investors should be looking to buy stocks that the market is wrong about. If the reality for a company is not as bad as the P/E ratio indicates, then the share price should increase as the market realizes this. So this free visual report on analyst forecasts could hold they key to an excellent investment decision.
Of course you might be able to find a better stock than Howden Joinery Group. So you may wish to see this free collection of other companies that have grown earnings strongly.
To help readers see past the short term volatility of the financial market, we aim to bring you a long-term focused research analysis purely driven by fundamental data. Note that our analysis does not factor in the latest price-sensitive company announcements.
The author is an independent contributor and at the time of publication had no position in the stocks mentioned. For errors that warrant correction please contact the editor at editorial-team@simplywallst.com.
