Don’t Sell The TJX Companies, Inc. (NYSE:TJX) Before You Read This

This article is for investors who would like to improve their understanding of price to earnings ratios (P/E ratios). We’ll show how you can use The TJX Companies, Inc.’s (NYSE:TJX) P/E ratio to inform your assessment of the investment opportunity. TJX Companies has a P/E ratio of 19.09, based on the last twelve months. That is equivalent to an earnings yield of about 5.2%.
View our latest analysis for TJX Companies
How Do I Calculate TJX Companies’s Price To Earnings Ratio?
The formula for price to earnings is:
Price to Earnings Ratio = Price per Share ÷ Earnings per Share (EPS)
Or for TJX Companies:
P/E of 19.09 = $47.31 ÷ $2.48 (Based on the trailing twelve months to November 2018.)
Is A High P/E Ratio Good?
A higher P/E ratio means that investors are paying a higher price for each $1 of company earnings. All else being equal, it’s better to pay a low price — but as Warren Buffett said, ‘It’s far better to buy a wonderful company at a fair price than a fair company at a wonderful price.’
How Growth Rates Impact P/E Ratios
Probably the most important factor in determining what P/E a company trades on is the earnings growth. That’s because companies that grow earnings per share quickly will rapidly increase the ‘E’ in the equation. Therefore, even if you pay a high multiple of earnings now, that multiple will become lower in the future. Then, a lower P/E should attract more buyers, pushing the share price up.
It’s nice to see that TJX Companies grew EPS by a stonking 31% in the last year. And its annual EPS growth rate over 5 years is 9.0%. So we’d generally expect it to have a relatively high P/E ratio.
How Does TJX Companies’s P/E Ratio Compare To Its Peers?
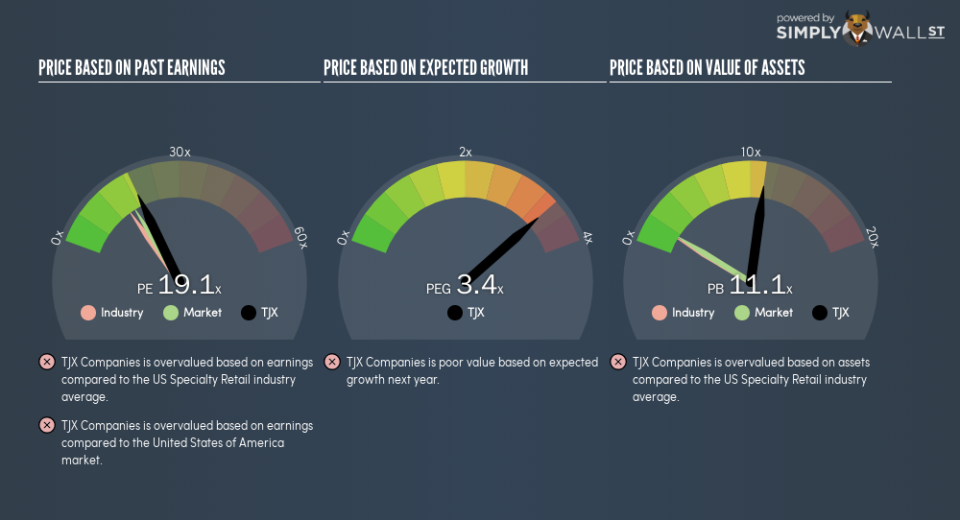
We can get an indication of market expectations by looking at the P/E ratio. The image below shows that TJX Companies has a higher P/E than the average (14.8) P/E for companies in the specialty retail industry.
TJX Companies’s P/E tells us that market participants think the company will perform better than its industry peers, going forward. Clearly the market expects growth, but it isn’t guaranteed. So investors should delve deeper. I like to check if company insiders have been buying or selling.
Don’t Forget: The P/E Does Not Account For Debt or Bank Deposits
The ‘Price’ in P/E reflects the market capitalization of the company. Thus, the metric does not reflect cash or debt held by the company. In theory, a company can lower its future P/E ratio by using cash or debt to invest in growth.
Such expenditure might be good or bad, in the long term, but the point here is that the balance sheet is not reflected by this ratio.
TJX Companies’s Balance Sheet
Since TJX Companies holds net cash of US$479m, it can spend on growth, justifying a higher P/E ratio than otherwise.
The Bottom Line On TJX Companies’s P/E Ratio
TJX Companies’s P/E is 19.1 which is above average (16.7) in the US market. Its net cash position supports a higher P/E ratio, as does its solid recent earnings growth. So it is not surprising the market is probably extrapolating recent growth well into the future, reflected in the relatively high P/E ratio.
Investors have an opportunity when market expectations about a stock are wrong. If the reality for a company is better than it expects, you can make money by buying and holding for the long term. So this free visual report on analyst forecasts could hold they key to an excellent investment decision.
Of course, you might find a fantastic investment by looking at a few good candidates. So take a peek at this free list of companies with modest (or no) debt, trading on a P/E below 20.
To help readers see past the short term volatility of the financial market, we aim to bring you a long-term focused research analysis purely driven by fundamental data. Note that our analysis does not factor in the latest price-sensitive company announcements.
The author is an independent contributor and at the time of publication had no position in the stocks mentioned. For errors that warrant correction please contact the editor at editorial-team@simplywallst.com.
