Don't Sell Church & Dwight Co., Inc. (NYSE:CHD) Before You Read This

This article is written for those who want to get better at using price to earnings ratios (P/E ratios). We'll show how you can use Church & Dwight Co., Inc.'s (NYSE:CHD) P/E ratio to inform your assessment of the investment opportunity. Church & Dwight has a price to earnings ratio of 31.58, based on the last twelve months. That means that at current prices, buyers pay $31.58 for every $1 in trailing yearly profits.
Check out our latest analysis for Church & Dwight
How Do I Calculate Church & Dwight's Price To Earnings Ratio?
The formula for price to earnings is:
Price to Earnings Ratio = Share Price ÷ Earnings per Share (EPS)
Or for Church & Dwight:
P/E of 31.58 = $75.36 ÷ $2.39 (Based on the trailing twelve months to March 2019.)
Is A High P/E Ratio Good?
The higher the P/E ratio, the higher the price tag of a business, relative to its trailing earnings. That is not a good or a bad thing per se, but a high P/E does imply buyers are optimistic about the future.
Does Church & Dwight Have A Relatively High Or Low P/E For Its Industry?
One good way to get a quick read on what market participants expect of a company is to look at its P/E ratio. The image below shows that Church & Dwight has a higher P/E than the average (26.1) P/E for companies in the household products industry.
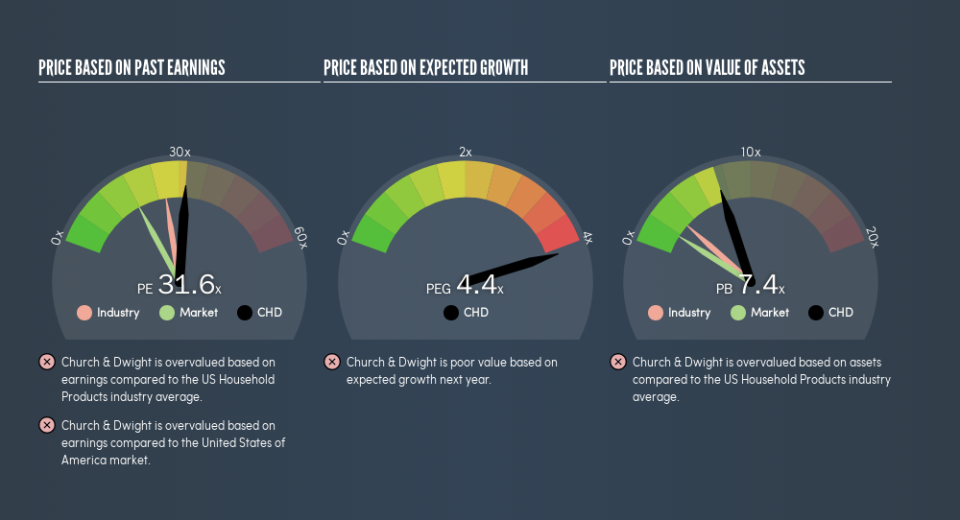
Church & Dwight's P/E tells us that market participants think the company will perform better than its industry peers, going forward. Shareholders are clearly optimistic, but the future is always uncertain. So investors should always consider the P/E ratio alongside other factors, such as whether company directors have been buying shares.
How Growth Rates Impact P/E Ratios
Probably the most important factor in determining what P/E a company trades on is the earnings growth. When earnings grow, the 'E' increases, over time. That means even if the current P/E is high, it will reduce over time if the share price stays flat. Then, a lower P/E should attract more buyers, pushing the share price up.
Church & Dwight saw earnings per share decrease by 23% last year. But it has grown its earnings per share by 11% per year over the last five years.
A Limitation: P/E Ratios Ignore Debt and Cash In The Bank
One drawback of using a P/E ratio is that it considers market capitalization, but not the balance sheet. Thus, the metric does not reflect cash or debt held by the company. Theoretically, a business can improve its earnings (and produce a lower P/E in the future) by investing in growth. That means taking on debt (or spending its cash).
Such spending might be good or bad, overall, but the key point here is that you need to look at debt to understand the P/E ratio in context.
Church & Dwight's Balance Sheet
Church & Dwight's net debt is 9.7% of its market cap. It would probably trade on a higher P/E ratio if it had a lot of cash, but I doubt it is having a big impact.
The Verdict On Church & Dwight's P/E Ratio
Church & Dwight's P/E is 31.6 which is above average (17.8) in its market. With some debt but no EPS growth last year, the market has high expectations of future profits.
When the market is wrong about a stock, it gives savvy investors an opportunity. People often underestimate remarkable growth -- so investors can make money when fast growth is not fully appreciated. So this free report on the analyst consensus forecasts could help you make a master move on this stock.
Of course you might be able to find a better stock than Church & Dwight. So you may wish to see this free collection of other companies that have grown earnings strongly.
We aim to bring you long-term focused research analysis driven by fundamental data. Note that our analysis may not factor in the latest price-sensitive company announcements or qualitative material.
If you spot an error that warrants correction, please contact the editor at editorial-team@simplywallst.com. This article by Simply Wall St is general in nature. It does not constitute a recommendation to buy or sell any stock, and does not take account of your objectives, or your financial situation. Simply Wall St has no position in the stocks mentioned. Thank you for reading.
