Don't Sell Crown Holdings, Inc. (NYSE:CCK) Before You Read This

Want to participate in a short research study? Help shape the future of investing tools and you could win a $250 gift card!
Today, we'll introduce the concept of the P/E ratio for those who are learning about investing. We'll show how you can use Crown Holdings, Inc.'s (NYSE:CCK) P/E ratio to inform your assessment of the investment opportunity. Based on the last twelve months, Crown Holdings's P/E ratio is 16.4. That corresponds to an earnings yield of approximately 6.1%.
Check out our latest analysis for Crown Holdings
How Do I Calculate A Price To Earnings Ratio?
The formula for price to earnings is:
Price to Earnings Ratio = Share Price ÷ Earnings per Share (EPS)
Or for Crown Holdings:
P/E of 16.4 = $55.45 ÷ $3.38 (Based on the trailing twelve months to March 2019.)
Is A High P/E Ratio Good?
The higher the P/E ratio, the higher the price tag of a business, relative to its trailing earnings. That isn't necessarily good or bad, but a high P/E implies relatively high expectations of what a company can achieve in the future.
How Growth Rates Impact P/E Ratios
Earnings growth rates have a big influence on P/E ratios. If earnings are growing quickly, then the 'E' in the equation will increase faster than it would otherwise. Therefore, even if you pay a high multiple of earnings now, that multiple will become lower in the future. So while a stock may look expensive based on past earnings, it could be cheap based on future earnings.
Crown Holdings increased earnings per share by a whopping 48% last year. And its annual EPS growth rate over 5 years is 8.7%. So we'd generally expect it to have a relatively high P/E ratio.
Does Crown Holdings Have A Relatively High Or Low P/E For Its Industry?
One good way to get a quick read on what market participants expect of a company is to look at its P/E ratio. The image below shows that Crown Holdings has a P/E ratio that is roughly in line with the packaging industry average (16.4).
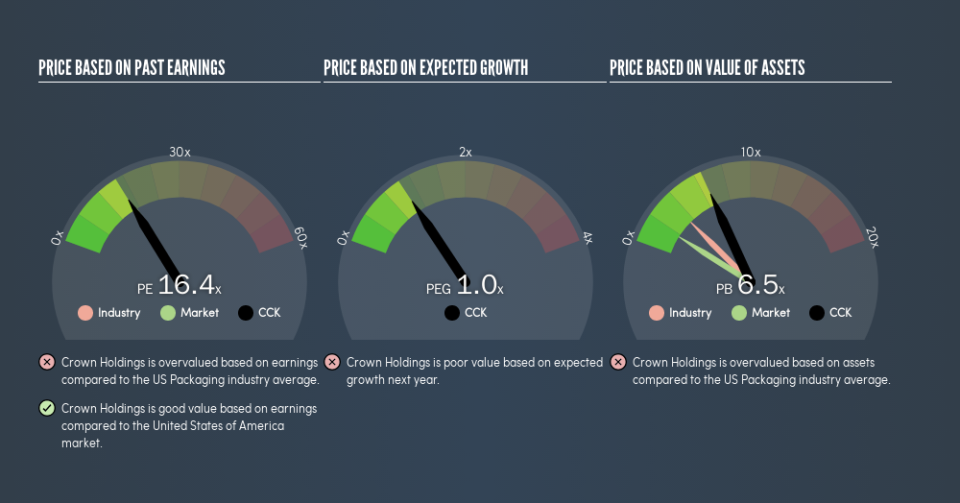
That indicates that the market expects Crown Holdings will perform roughly in line with other companies in its industry. So if Crown Holdings actually outperforms its peers going forward, that should be a positive for the share price. I inform my view byby checking management tenure and remuneration, among other things.
Remember: P/E Ratios Don't Consider The Balance Sheet
The 'Price' in P/E reflects the market capitalization of the company. That means it doesn't take debt or cash into account. Theoretically, a business can improve its earnings (and produce a lower P/E in the future) by investing in growth. That means taking on debt (or spending its cash).
Spending on growth might be good or bad a few years later, but the point is that the P/E ratio does not account for the option (or lack thereof).
Crown Holdings's Balance Sheet
Crown Holdings's net debt is considerable, at 121% of its market cap. This level of debt justifies a relatively low P/E, so remain cognizant of the debt, if you're comparing it to other stocks.
The Bottom Line On Crown Holdings's P/E Ratio
Crown Holdings has a P/E of 16.4. That's around the same as the average in the US market, which is 17.1. While it does have meaningful debt levels, it has also produced strong earnings growth recently. The P/E suggests that the market is not convinced EPS will continue to improve strongly.
Investors have an opportunity when market expectations about a stock are wrong. If it is underestimating a company, investors can make money by buying and holding the shares until the market corrects itself. So this free report on the analyst consensus forecasts could help you make a master move on this stock.
Of course, you might find a fantastic investment by looking at a few good candidates. So take a peek at this free list of companies with modest (or no) debt, trading on a P/E below 20.
We aim to bring you long-term focused research analysis driven by fundamental data. Note that our analysis may not factor in the latest price-sensitive company announcements or qualitative material.
If you spot an error that warrants correction, please contact the editor at editorial-team@simplywallst.com. This article by Simply Wall St is general in nature. It does not constitute a recommendation to buy or sell any stock, and does not take account of your objectives, or your financial situation. Simply Wall St has no position in the stocks mentioned. Thank you for reading.
