Don't Sell Northwest Bancshares, Inc. (NASDAQ:NWBI) Before You Read This

This article is written for those who want to get better at using price to earnings ratios (P/E ratios). To keep it practical, we'll show how Northwest Bancshares, Inc.'s (NASDAQ:NWBI) P/E ratio could help you assess the value on offer. Northwest Bancshares has a P/E ratio of 16.73, based on the last twelve months. That means that at current prices, buyers pay $16.73 for every $1 in trailing yearly profits.
Want to participate in a short research study? Help shape the future of investing tools and you could win a $250 gift card!
Check out our latest analysis for Northwest Bancshares
How Do You Calculate A P/E Ratio?
The formula for P/E is:
Price to Earnings Ratio = Share Price ÷ Earnings per Share (EPS)
Or for Northwest Bancshares:
P/E of 16.73 = $17.24 ÷ $1.03 (Based on the year to March 2019.)
Is A High Price-to-Earnings Ratio Good?
A higher P/E ratio means that investors are paying a higher price for each $1 of company earnings. That isn't necessarily good or bad, but a high P/E implies relatively high expectations of what a company can achieve in the future.
How Growth Rates Impact P/E Ratios
P/E ratios primarily reflect market expectations around earnings growth rates. When earnings grow, the 'E' increases, over time. That means even if the current P/E is high, it will reduce over time if the share price stays flat. A lower P/E should indicate the stock is cheap relative to others -- and that may attract buyers.
Northwest Bancshares increased earnings per share by 2.6% last year. And earnings per share have improved by 7.3% annually, over the last five years.
How Does Northwest Bancshares's P/E Ratio Compare To Its Peers?
The P/E ratio essentially measures market expectations of a company. The image below shows that Northwest Bancshares has a higher P/E than the average (14.2) P/E for companies in the mortgage industry.
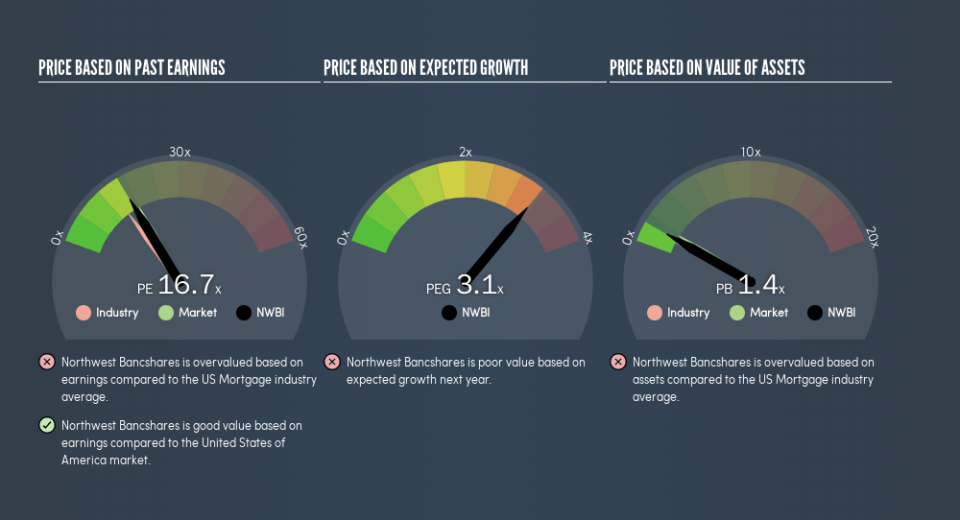
Northwest Bancshares's P/E tells us that market participants think the company will perform better than its industry peers, going forward. Clearly the market expects growth, but it isn't guaranteed. So further research is always essential. I often monitor director buying and selling.
Remember: P/E Ratios Don't Consider The Balance Sheet
One drawback of using a P/E ratio is that it considers market capitalization, but not the balance sheet. In other words, it does not consider any debt or cash that the company may have on the balance sheet. The exact same company would hypothetically deserve a higher P/E ratio if it had a strong balance sheet, than if it had a weak one with lots of debt, because a cashed up company can spend on growth.
Spending on growth might be good or bad a few years later, but the point is that the P/E ratio does not account for the option (or lack thereof).
So What Does Northwest Bancshares's Balance Sheet Tell Us?
Northwest Bancshares has net debt worth 10% of its market capitalization. This could bring some additional risk, and reduce the number of investment options for management; worth remembering if you compare its P/E to businesses without debt.
The Bottom Line On Northwest Bancshares's P/E Ratio
Northwest Bancshares has a P/E of 16.7. That's around the same as the average in the US market, which is 17.7. With modest debt and some recent earnings growth, it seems likely the market expects a steady performance going forward.
Investors have an opportunity when market expectations about a stock are wrong. As value investor Benjamin Graham famously said, 'In the short run, the market is a voting machine but in the long run, it is a weighing machine.' So this free visual report on analyst forecasts could hold the key to an excellent investment decision.
But note: Northwest Bancshares may not be the best stock to buy. So take a peek at this free list of interesting companies with strong recent earnings growth (and a P/E ratio below 20).
We aim to bring you long-term focused research analysis driven by fundamental data. Note that our analysis may not factor in the latest price-sensitive company announcements or qualitative material.
If you spot an error that warrants correction, please contact the editor at editorial-team@simplywallst.com. This article by Simply Wall St is general in nature. It does not constitute a recommendation to buy or sell any stock, and does not take account of your objectives, or your financial situation. Simply Wall St has no position in the stocks mentioned. Thank you for reading.
