Don't Sell Vertex Pharmaceuticals Incorporated (NASDAQ:VRTX) Before You Read This

This article is for investors who would like to improve their understanding of price to earnings ratios (P/E ratios). We'll apply a basic P/E ratio analysis to Vertex Pharmaceuticals Incorporated's (NASDAQ:VRTX), to help you decide if the stock is worth further research. What is Vertex Pharmaceuticals's P/E ratio? Well, based on the last twelve months it is 23.54. That is equivalent to an earnings yield of about 4.2%.
View our latest analysis for Vertex Pharmaceuticals
How Do I Calculate Vertex Pharmaceuticals's Price To Earnings Ratio?
The formula for P/E is:
Price to Earnings Ratio = Price per Share ÷ Earnings per Share (EPS)
Or for Vertex Pharmaceuticals:
P/E of 23.54 = $197.14 ÷ $8.38 (Based on the year to September 2019.)
Is A High Price-to-Earnings Ratio Good?
A higher P/E ratio means that investors are paying a higher price for each $1 of company earnings. That isn't a good or a bad thing on its own, but a high P/E means that buyers have a higher opinion of the business's prospects, relative to stocks with a lower P/E.
How Does Vertex Pharmaceuticals's P/E Ratio Compare To Its Peers?
The P/E ratio essentially measures market expectations of a company. You can see in the image below that the average P/E (17.5) for companies in the biotechs industry is lower than Vertex Pharmaceuticals's P/E.
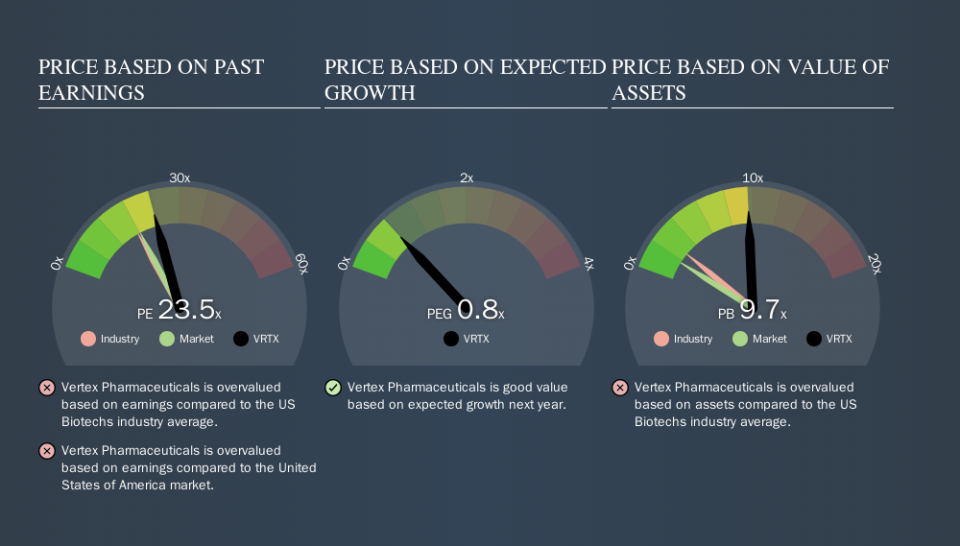
Vertex Pharmaceuticals's P/E tells us that market participants think the company will perform better than its industry peers, going forward. Shareholders are clearly optimistic, but the future is always uncertain. So investors should delve deeper. I like to check if company insiders have been buying or selling.
How Growth Rates Impact P/E Ratios
Earnings growth rates have a big influence on P/E ratios. If earnings are growing quickly, then the 'E' in the equation will increase faster than it would otherwise. That means unless the share price increases, the P/E will reduce in a few years. So while a stock may look expensive based on past earnings, it could be cheap based on future earnings.
Vertex Pharmaceuticals's earnings made like a rocket, taking off 228% last year.
A Limitation: P/E Ratios Ignore Debt and Cash In The Bank
Don't forget that the P/E ratio considers market capitalization. Thus, the metric does not reflect cash or debt held by the company. The exact same company would hypothetically deserve a higher P/E ratio if it had a strong balance sheet, than if it had a weak one with lots of debt, because a cashed up company can spend on growth.
Spending on growth might be good or bad a few years later, but the point is that the P/E ratio does not account for the option (or lack thereof).
So What Does Vertex Pharmaceuticals's Balance Sheet Tell Us?
Since Vertex Pharmaceuticals holds net cash of US$4.0b, it can spend on growth, justifying a higher P/E ratio than otherwise.
The Bottom Line On Vertex Pharmaceuticals's P/E Ratio
Vertex Pharmaceuticals trades on a P/E ratio of 23.5, which is above its market average of 18.3. The excess cash it carries is the gravy on top its fast EPS growth. To us, this is the sort of company that we would expect to carry an above average price tag (relative to earnings).
When the market is wrong about a stock, it gives savvy investors an opportunity. As value investor Benjamin Graham famously said, 'In the short run, the market is a voting machine but in the long run, it is a weighing machine. So this free report on the analyst consensus forecasts could help you make a master move on this stock.
Of course, you might find a fantastic investment by looking at a few good candidates. So take a peek at this free list of companies with modest (or no) debt, trading on a P/E below 20.
We aim to bring you long-term focused research analysis driven by fundamental data. Note that our analysis may not factor in the latest price-sensitive company announcements or qualitative material.
If you spot an error that warrants correction, please contact the editor at editorial-team@simplywallst.com. This article by Simply Wall St is general in nature. It does not constitute a recommendation to buy or sell any stock, and does not take account of your objectives, or your financial situation. Simply Wall St has no position in the stocks mentioned. Thank you for reading.
