What Are The Drivers Of J & B. Ladenis Bros SA MINERVA Knitwear Manufacturing Company’s (ATH:MIN) Risks?

If you are a shareholder in J & B. Ladenis Bros SA MINERVA Knitwear Manufacturing Company’s (ATSE:MIN), or are thinking about investing in the company, knowing how it contributes to the risk and reward profile of your portfolio is important. MIN is exposed to market-wide risk, which arises from investing in the stock market. This risk reflects changes in economic and political factors that affects all stocks, and is measured by its beta. Not all stocks are expose to the same level of market risk, and the broad market index represents a beta value of one. A stock with a beta greater than one is expected to exhibit higher volatility resulting from market-wide shocks compared to one with a beta below one.
Check out our latest analysis for J. & B. Ladenis Bros SA MINERVA Knitwear Manufacturing
An interpretation of MIN’s beta
J. & B. Ladenis Bros SA MINERVA Knitwear Manufacturing’s five-year beta of 2.74 means that the company’s value will swing up by more than the market during prosperous times, but also drop down by more in times of downturns. This level of volatility indicates bigger risk for investors who passively invest in the stock market index. According to this value of beta, MIN can help magnify your portfolio return, especially if it is predominantly made up of low-beta stocks. If the market is going up, a higher exposure to the upside from a high-beta stock can push up your portfolio return.
Does MIN’s size and industry impact the expected beta?
With a market cap of €1.46M, MIN falls within the small-cap spectrum of stocks, which are found to experience higher relative risk compared to larger companies. Furthermore, the company operates in the luxury industry, which has been found to have high sensitivity to market-wide shocks. So, investors should expect a larger beta for smaller companies operating in a cyclical industry in contrast with lower beta for larger firms in a more defensive industry. This is consistent with MIN’s individual beta value we discussed above. Fundamental factors can also drive the cyclicality of the stock, which we will take a look at next.
How MIN’s assets could affect its beta
An asset-heavy company tends to have a higher beta because the risk associated with running fixed assets during a downturn is highly expensive. I examine MIN’s ratio of fixed assets to total assets to see whether the company is highly exposed to the risk of this type of constraint. With a fixed-assets-to-total-assets ratio of greater than 30%, MIN appears to be a company that invests a large amount of capital in assets that are hard to scale down on short-notice. Thus, we can expect MIN to be more volatile in the face of market movements, relative to its peers of similar size but with a lower proportion of fixed assets on their books. This is consistent with is current beta value which also indicates high volatility.
What this means for you:
You could benefit from higher returns from MIN during times of economic growth. Its higher fixed cost isn’t a major concern given margins are covered with high consumer demand. Though, in times of a downturn, it may be safe to look at a more defensive stock which can cushion the impact of lower demand. In order to fully understand whether MIN is a good investment for you, we also need to consider important company-specific fundamentals such as J. & B. Ladenis Bros SA MINERVA Knitwear Manufacturing’s financial health and performance track record. I highly recommend you to complete your research by taking a look at the following:
Financial Health: Is MIN’s operations financially sustainable? Balance sheets can be hard to analyze, which is why we’ve done it for you. Check out our financial health checks here.
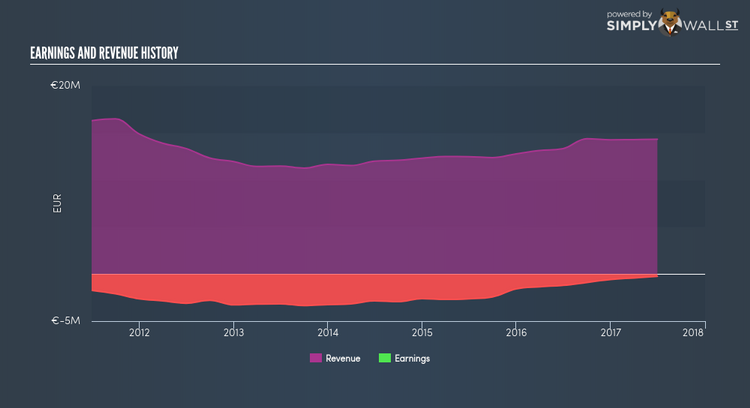
Past Track Record: Has MIN been consistently performing well irrespective of the ups and downs in the market? Go into more detail in the past performance analysis and take a look at the free visual representations of MIN’s historicals for more clarity.
Other High-Performing Stocks: Are there other stocks that provide better prospects with proven track records? Explore our free list of these great stocks here.
To help readers see pass the short term volatility of the financial market, we aim to bring you a long-term focused research analysis purely driven by fundamental data. Note that our analysis does not factor in the latest price sensitive company announcements.
The author is an independent contributor and at the time of publication had no position in the stocks mentioned.
