Can Dycom Industries, Inc. (NYSE:DY) Improve Its Returns?

One of the best investments we can make is in our own knowledge and skill set. With that in mind, this article will work through how we can use Return On Equity (ROE) to better understand a business. To keep the lesson grounded in practicality, we'll use ROE to better understand Dycom Industries, Inc. (NYSE:DY).
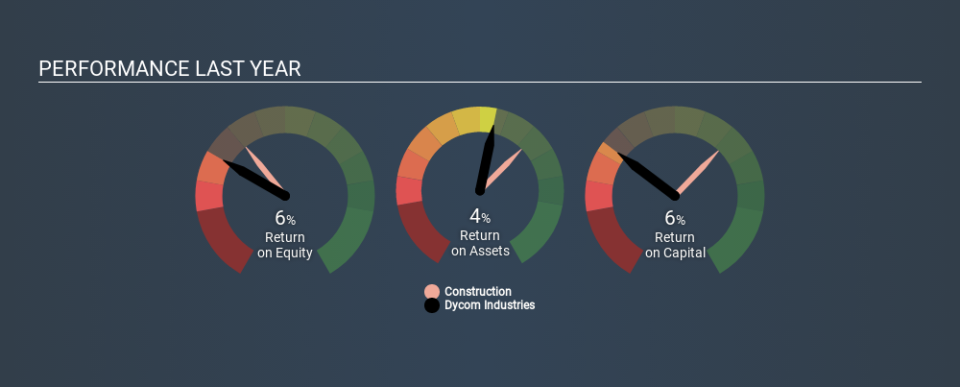
Over the last twelve months Dycom Industries has recorded a ROE of 6.4%. One way to conceptualize this, is that for each $1 of shareholders' equity it has, the company made $0.06 in profit.
Check out our latest analysis for Dycom Industries
How Do I Calculate ROE?
The formula for ROE is:
Return on Equity = Net Profit (from continuing operations) ÷ Shareholders' Equity
Or for Dycom Industries:
6.4% = US$56m ÷ US$880m (Based on the trailing twelve months to October 2019.)
It's easy to understand the 'net profit' part of that equation, but 'shareholders' equity' requires further explanation. It is all earnings retained by the company, plus any capital paid in by shareholders. Shareholders' equity can be calculated by subtracting the total liabilities of the company from the total assets of the company.
What Does Return On Equity Signify?
ROE looks at the amount a company earns relative to the money it has kept within the business. The 'return' is the yearly profit. The higher the ROE, the more profit the company is making. So, as a general rule, a high ROE is a good thing. Clearly, then, one can use ROE to compare different companies.
Does Dycom Industries Have A Good ROE?
Arguably the easiest way to assess company's ROE is to compare it with the average in its industry. Importantly, this is far from a perfect measure, because companies differ significantly within the same industry classification. If you look at the image below, you can see Dycom Industries has a lower ROE than the average (9.8%) in the Construction industry classification.
That certainly isn't ideal. It is better when the ROE is above industry average, but a low one doesn't necessarily mean the business is overpriced. Nonetheless, it might be wise to check if insiders have been selling.
The Importance Of Debt To Return On Equity
Most companies need money -- from somewhere -- to grow their profits. That cash can come from retained earnings, issuing new shares (equity), or debt. In the case of the first and second options, the ROE will reflect this use of cash, for growth. In the latter case, the debt used for growth will improve returns, but won't affect the total equity. Thus the use of debt can improve ROE, albeit along with extra risk in the case of stormy weather, metaphorically speaking.
Combining Dycom Industries's Debt And Its 6.4% Return On Equity
It's worth noting the significant use of debt by Dycom Industries, leading to its debt to equity ratio of 1.13. While the ROE isn't too bad, it would probably be a lot lower if the company was forced to reduce debt. Debt does bring extra risk, so it's only really worthwhile when a company generates some decent returns from it.
But It's Just One Metric
Return on equity is useful for comparing the quality of different businesses. In my book the highest quality companies have high return on equity, despite low debt. If two companies have around the same level of debt to equity, and one has a higher ROE, I'd generally prefer the one with higher ROE.
But ROE is just one piece of a bigger puzzle, since high quality businesses often trade on high multiples of earnings. It is important to consider other factors, such as future profit growth -- and how much investment is required going forward. So you might want to check this FREE visualization of analyst forecasts for the company.
Of course, you might find a fantastic investment by looking elsewhere. So take a peek at this free list of interesting companies.
If you spot an error that warrants correction, please contact the editor at editorial-team@simplywallst.com. This article by Simply Wall St is general in nature. It does not constitute a recommendation to buy or sell any stock, and does not take account of your objectives, or your financial situation. Simply Wall St has no position in the stocks mentioned.
We aim to bring you long-term focused research analysis driven by fundamental data. Note that our analysis may not factor in the latest price-sensitive company announcements or qualitative material. Thank you for reading.
