E-mini Dow Jones Industrial Average (YM) Futures Technical Analysis – Trader Reaction to 31450 Sets the Tone
March E-mini Dow Jones Industrial Average futures are trading lower at the mid-session on Tuesday after failing to follow-through to the upside following yesterday’s strong performance. Helping to hold prices in a tight range are concerns over the impact of the surge in bond yields. Investors are also eyeing the progress toward the passing of President Joe Biden’s coronavirus relief bill.
At 17:47 GMT, March E-mini Dow Jones Industrial Average futures are at 31453, down 56 or -0.18%.
Daily Swing Chart Technical Analysis
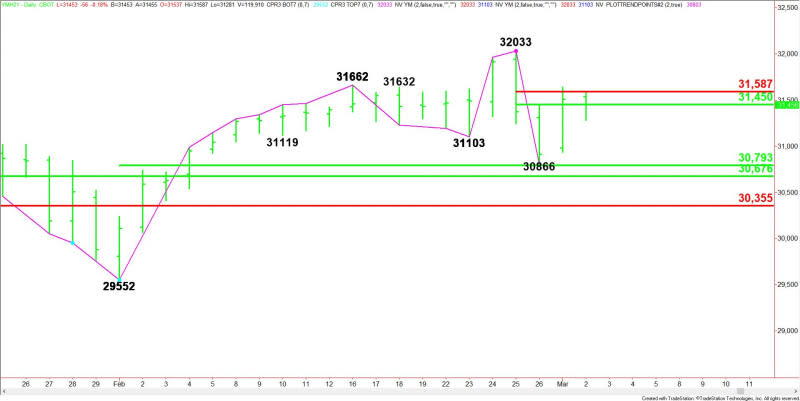
The main trend is down according to the daily swing chart. A trade through 32033 will change the main trend to up. A move through 30866 will signal a resumption of the downtrend.
The minor range is 32033 to 30866. The Dow is currently testing its retracement zone at 31450 to 31587. Trend trading sellers are coming in to stop the rally in an effort to form a potentially bearish secondary lower top. Aggressive buyers are trying to drive the market through 31587 in an effort to challenge the record high at 32033.
The inside trading range suggests investor indecision and impending volatility.
On the downside, the first support is a 50% level at 30793. This is followed by a retracement zone at 30676 to 30355.
Daily Swing Chart Technical Forecast
The direction of the March E-mini Dow Jones Industrial Average into the close on Tuesday will be determined by trader reaction to 31450 and 31587.
Bullish Scenario
Overtaking 31450 will be the first sign of strength, while a sustained move over 31587 will indicate the buying is getting stronger. This could create the upside momentum needed to challenge the record high at 32033.
Bearish Scenario
A sustained move under 31450 will signal the presence of sellers. If this move generates enough downside momentum then look for a test of last week’s low at 30866, followed by a pair of 50% levels at 30793 and 30676.
For a look at all of today’s economic events, check out our economic calendar.
This article was originally posted on FX Empire
