E-mini Dow Jones Industrial Average (YM) Futures Technical Analysis – Stable after This Week’s Brutal Selloff
September E-mini Dow Jones Industrial Average futures are up late in the session on Friday after erasing an earlier deficit. Nonetheless, the volatile price action suggests investors are still grappling with a likely recession after the Federal Reserve and other major central banks aggressively raised interest rates this week in an effort to tame soaring inflation.
At 19:01 GMT, September E-mini Dow futures are trading 30030, up 111 or +0.37%. The SPDR Dow Jones Industrial Average ETF (DIA) is at $300.47, up $1.26 or +0.42%.
Earlier in the year, the blue chip average was pressured by hot inflation readings. Then it was the fear of higher interest rates weighing on prices. This week, concerns over the aggressiveness of most major central banks, attributed to a brutal sell-off as traders priced in a slowing economy and lower corporate earnings.
Powell Speaks as Factory Orders Fell
On Friday, Fed Chair Jerome Powell once again stressed the central bank’s focus on bringing back inflation to its 2% target while speaking at a conference.
Meanwhile, economic data on Friday showed production at U.S. factories fell unexpectedly in the latest indication economic activity was on the wane.
Daily Swing Chart Technical Analysis
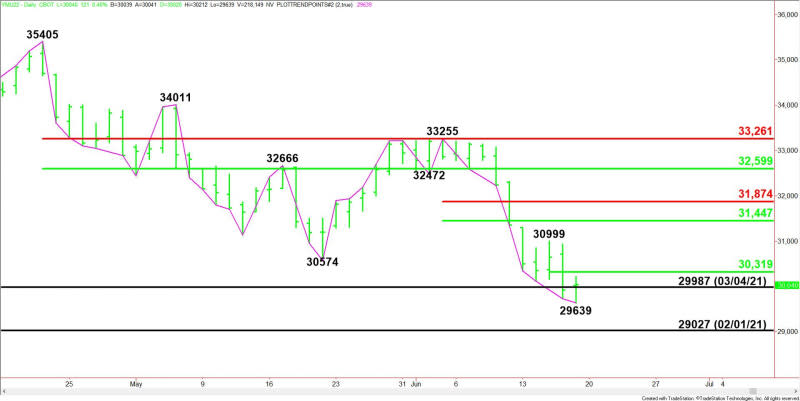
The main trend is down according to the daily swing chart. A trade through 29639 will signal a resumption of the downtrend.
A move through 33255 will change the main trend to up. This is highly unlikely but due to the prolonged move down in terms of price and time, the market is ripe for a potentially bullish closing price reversal bottom. This won’t change the trend, but if confirmed, it could trigger the start of a 2 to 3 day counter-trend rally.
The minor trend is also down. A trade through 30999 will change the minor trend to up. This will shift momentum to the upside.
The minor range is 30999 to 29639. The E-mini Dow is trading below its pivot at 30319, making it resistance.
The short-term range is 33255 to 29639. If the minor trend changes to up then its retracement zone at 31447 – 31874 will become the next target area.
Daily Swing Chart Technical Forecast
Trader reaction to 29919 is likely to determine the direction of the September E-mini Dow Jones futures contract into the close on Friday.
Bullish Scenario
A sustained move over 29919 will indicate the presence of buyers. This could trigger a late session surge into the pivot at 30319.
Bearish Scenario
A sustained move under 29919 will signal the presence of sellers. This could lead to a retest of the intraday low at 29639.
For a look at all of today’s economic events, check out our economic calendar.
This article was originally posted on FX Empire
More From FXEMPIRE:
Stocks in biggest weekly loss since 2020 on interest-rate worries
U.S. senators press TikTok on whether it allows Russian ‘pro-war propaganda’
Colombia’s government, Ecopetrol will shore up fuel price fund
Bolivia delays decision on lithium mining tie-ups to December
Fed policy needs to be more ‘muscular’ to battle high inflation -Bostic
