E-mini NASDAQ-100 Index (NQ) Futures Technical Analysis – Trader Reaction to 8576.50 Sets the Tone
June E-mini NASDAQ-100 Index futures fell on Wednesday as weak economic data and first-quarter earnings reports compounded concerns over the extent of damage from the coronavirus outbreak.
Tesla stock, however, bucked the trend, extending its recent rally on Wednesday following a surge in China car registrations and after Goldman Sachs initiated coverage of the electric car maker with a “buy’ recommendation.
On Wednesday, June E-mini NASDAQ-100 Index futures settled at 8594.00, down 98.50 or -1.15%.
Shares of the Silicon Valley automaker rose nearly 2%, bringing their gain this week to 26% as traders look beyond the short-term impact of the coronavirus pandemic, which has forced Tesla to close its California factor, furlough workers and cut salaries.
Daily Swing Chart Technical Analysis
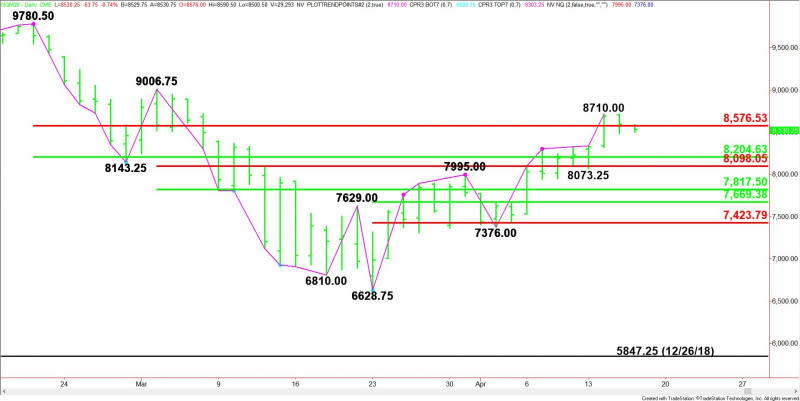
The main trend is up according to the daily swing chart. A trade through 8710.00 will signal a resumption of the uptrend. The main trend will change to down on a move through the last main bottom at 7376.00.
The minor trend is also up. A trade through 8073.25 will change the minor trend to down. This will also shift momentum to the downside.
The main range is 9780.50 to 6628.75. The index is currently testing is retracement zone at 8204.50 to 8576.50. This zone is controlling the longer-term term direction of the index.
The intermediate range is 9006.75 to 6628.75. Its retracement zone at 7817.50 to 8098.00 is the next potential support zone.
The short-term range is 6628.75 to 8710.00. Its retracement zone at 7669.25 to 7423.75 is another potential support area.
Daily Swing Chart Technical Forecast
Based on the price action the last two days and the close at 8594.00, the direction of the June E-mini NASDAQ-100 Index on Thursday is likely to be determined by trader reaction to the main Fibonacci level at 8576.50.
Bullish Outlook
A sustained move over 8576.50 will indicate the presence of buyers. Taking out 8710.00 with high volume could lead to an eventual test of the next major main top at 9006.75.
Bearish Outlook
A sustained move under 8576.50 will signal the presence of sellers. If this creates enough downside momentum then look for the selling to possibly extend into 8204.50 to 8098.00.
This article was originally posted on FX Empire
