E-mini NASDAQ-100 Index (NQ) Futures Technical Analysis – Strong Upside Momentum into Close
June E-mini NASDAQ-100 Index futures finished higher on Friday, recovering from a four-day losing streak, as data showed U.S. job creation was more robust than forecast in April. The technology-based index was also supported by a surge in shares of Amazon after Warren Buffett said his company, Berkshire Hathaway, was buying the online-retail sales giant’s stock.
On Friday, June E-mini NASDAQ-100 Index futures settled at 7865.00, up 130.75 or +1.66%.
Daily Swing Chart Technical Analysis
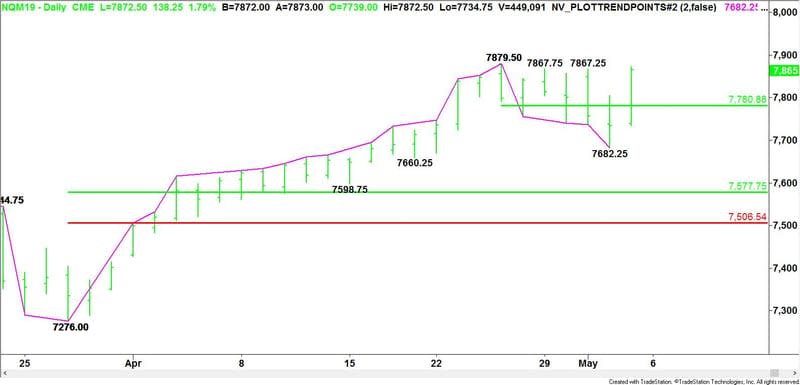
The main trend is up according to the two-bar swing chart. The main trend will change to down on a trade through 7276.00. A trade through 7879.50 will signal a resumption of the uptrend. The will raise the main bottom to 7682.25.
The minor trend is also up. It changed back to up on Friday’s trade through 7867.25. This also shifted momentum back to the upside. A move through 7682.25 will change the minor trend to down.
As of Friday’s close, the short-term range was 7879.50 to 7682.25. Its 50% level or pivot is 7780.75. Holding above this pivot will give the index an upside bias. Falling below the pivot will indicate the selling is greater than the buying at current price levels.
The main range is 7276.00 to 7879.50. If the minor trend changes to down then its retracement zone at 7577.75 to 7506.50 will become the primary downside target.
Daily Swing Chart Forecast
Based on the strong momentum into Friday’s close, it looks as if the June E-mini NASDAQ-100 Index will take out the top at 7879.50 early next week. This will signal a resumption of the uptrend.
There is no resistance at this time since we are at historical highs. If we haven’t been there before, how can we have resistance? Moving Averages can’t show you resistance because all of the prices used to calculate the average are below the market.
Oscillators and indicators have been showing overbought for weeks. If you do get a crossover to the downside by the RSI or Stochastic Indicators then it will be coincidental with a downturn in the market.
Projections and Fibonacci extensions can show you areas of interest, but they are not resistance. They can become resistance if enough sellers show up at those prices to drive the index lower.
The best signal of a top will be a higher-high, lower-close or better known as a closing price reversal top. I’d rather sell weakness than strength.
This article was originally posted on FX Empire
More From FXEMPIRE:
US Stock Market Overview – Stocks Surge Following Robust Jobs Data
AUD/USD Weekly Price Forecast – the Australian dollar continues to test support
Natural Gas Price Prediction – Prices Drop Despite Uptick in Demand
Weekly Wrap – The Pound Stole the Show at the Expense of the Dollar
E-mini NASDAQ-100 Index (NQ) Futures Technical Analysis – Strong Upside Momentum into Close
Silver Price Forecast – Silver markets exploded to the upside on Friday
