E-mini NASDAQ-100 Index (NQ) Futures Technical Analysis – June 19, 2019 Forecast
September E-mini NASDAQ-100 Index futures are trading lower at the mid-session and shortly before the release of the Federal Reserve’s interest rate decision and monetary policy statement at 18:00 GMT. The market continues to be supported by the hope the U.S. and China will return to the negotiation table, but we may not know for sure for 10 days. In the meantime, the focus for investors will be on the timing and frequency of the expected Fed rate cuts.
At 16:29 GMT, September E-mini NASDAQ-100 Index futures are trading 7658.25, down 15.00 or -0.20%.
Bullish traders are hoping the Fed signals three rate cuts this year with the first coming in July. Stocks could weaken if the Fed hints at skipping a July cut and scheduling its first cut in more than 10 years for September.
Basically, the announcement of three rate cuts starting in July will be dovish, but bullish for stocks. The announcement of two or three rate cuts with the first likely in September will be hawkish and short-term bearish for stocks.
Daily Technical Analysis
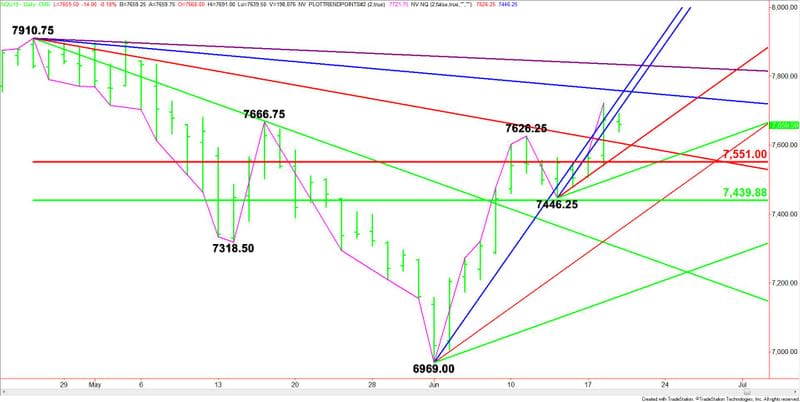
The main trend is up according to the daily swing chart. The trend changed to up on Tuesday when buyers took out 7626.25 and reaffirmed when buyers took out 7666.75. The main trend will change to down on a move through 7446.25.
The main range is 7910.75 to 6969.00. Its retracement zone at 7551.00 to 7439.75 is controlling the longer-term direction of the index. Holding above will maintain the upside bias. This zone is support.
Daily Technical Forecast
Based on the early price action, the direction of the September E-mini NASDAQ-100 Index on Wednesday is likely to be determined by trader reaction to the short-term uptrending Gann angle at 7702.25.
Bullish Scenario
A sustained move over 7702.25 will indicate the presence of buyers. Overcoming this angle and the long-term uptrending Gann angle at 7737.00. This could lead to a test of a downtrending Gann angle at 7758.75. This angle is a potential trigger point for an acceleration to the upside with the next target angle coming in at 7834.75. This is the last potential resistance angle before the 7910.75 main top.
Bearish Scenario
A sustained move under 7702.25 will signal the presence of sellers. The first targets are a downtrending Gann angle at 7606.25 and a short-term uptrending Gann angle at 7574.25.
Crossing to the weak side of this angle will lead to a test of the Fibonacci level at 7551.00. This is a potential trigger point for an acceleration to the downside with potential targets a main bottom at 7446.25 and the main 50% level at 7439.75.
Overview
Basically, a sustained move over 7737.00 will give the market an upside bias. A sustained move under 7702.25 will help generate a downside bias.
This article was originally posted on FX Empire
