E-mini NASDAQ-100 Index (NQ) Futures Technical Analysis – Weakens Under 7314.75, Strengthens Over 7422.75
The technology-based NASDAQ Composite finished sharply lower on Thursday as investors continued to react to escalating trade tensions between the United States and China. Fallout from the U.S. move against telecom company Hauwei also weighed on prices. Furthermore, weak U.S. manufacturing data drove investors out of the equity markets and into the safe-have Treasurys.
At 20:58 GMT, June E-mini NASDAQ-100 Index futures are trading 7314.50, down 115.50 or -1.55%.
The index was driven lower by weakness in shares of Apple, which fell 1.7%. Shares of Qualcomm continued to erode, falling 1.5%. Xilinx was down 2.3% and Micron Technology was off by 2.6%.
Daily Swing Chart Technical Analysis
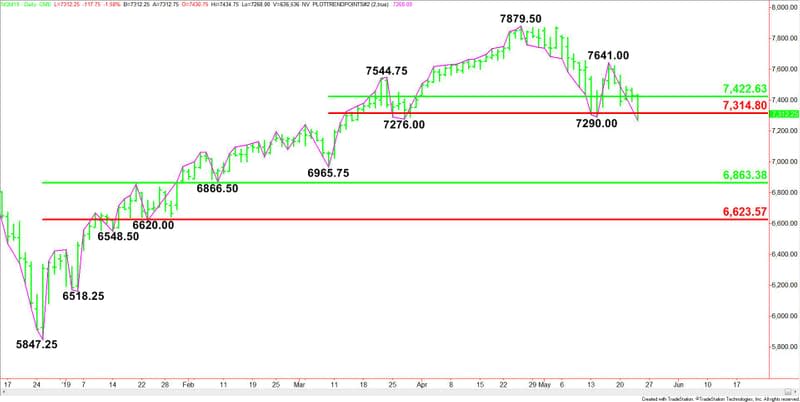
The main trend is down according to the daily swing chart. A trade through 7290.00 changed the main trend to down. The new main top is 7641.00. A trade through this top will change the main trend to up.
The next main bottom target is 7276.00. This is a potential trigger point for an acceleration to the downside with the next target the main bottom at 6965.75.
The short-term range is 6965.75 to 7879.50. The index is currently straddling its retracement zone at 7422.75 to 7314.75. This zone may be acting like a short-term pivot.
The main range is 5847.25 to 7879.50. If traders continue to press the index lower then look for the selling to possibly extend into the main retracement zone at 6863.25 to 6623.50.
Daily Swing Chart Technical Forecast
Based on Thursday’s price action and the close at 7311.00, the direction of the next move is likely to be determined by trader reaction to the short-term Fibonacci level at 7314.75.
Bearish Scenario
A sustained move under 7314.75 will indicate the presence of sellers. We could start to see a steep sell-off developing if sellers can plow through the former main bottoms at 7290.00 and 7276.00 a second time.
The daily chart is wide open under 7276.00 with the next main bottom targets at 6965.75 and 6866.50, followed by the main 50% level at 6863.25.
Furthermore, the daily swing chart has identified a target of 7051.50 on June 4.
Bullish Scenario
The inability to follow-through to the downside under 7290.00 and 7276.00 will signal that aggressive counter-trend buyers are coming in to support the market. Overcoming the short-term Fibonacci at 7314.75 and the short-term 50% levels at 7422.75 will indicate the short-covering is getting stronger. This will bring the main top at 7641.00 back into play.
This article was originally posted on FX Empire
